

XRP Price: Trendline Support and Accumulation Zone Signal Possible Buying Opportunity
TLDR
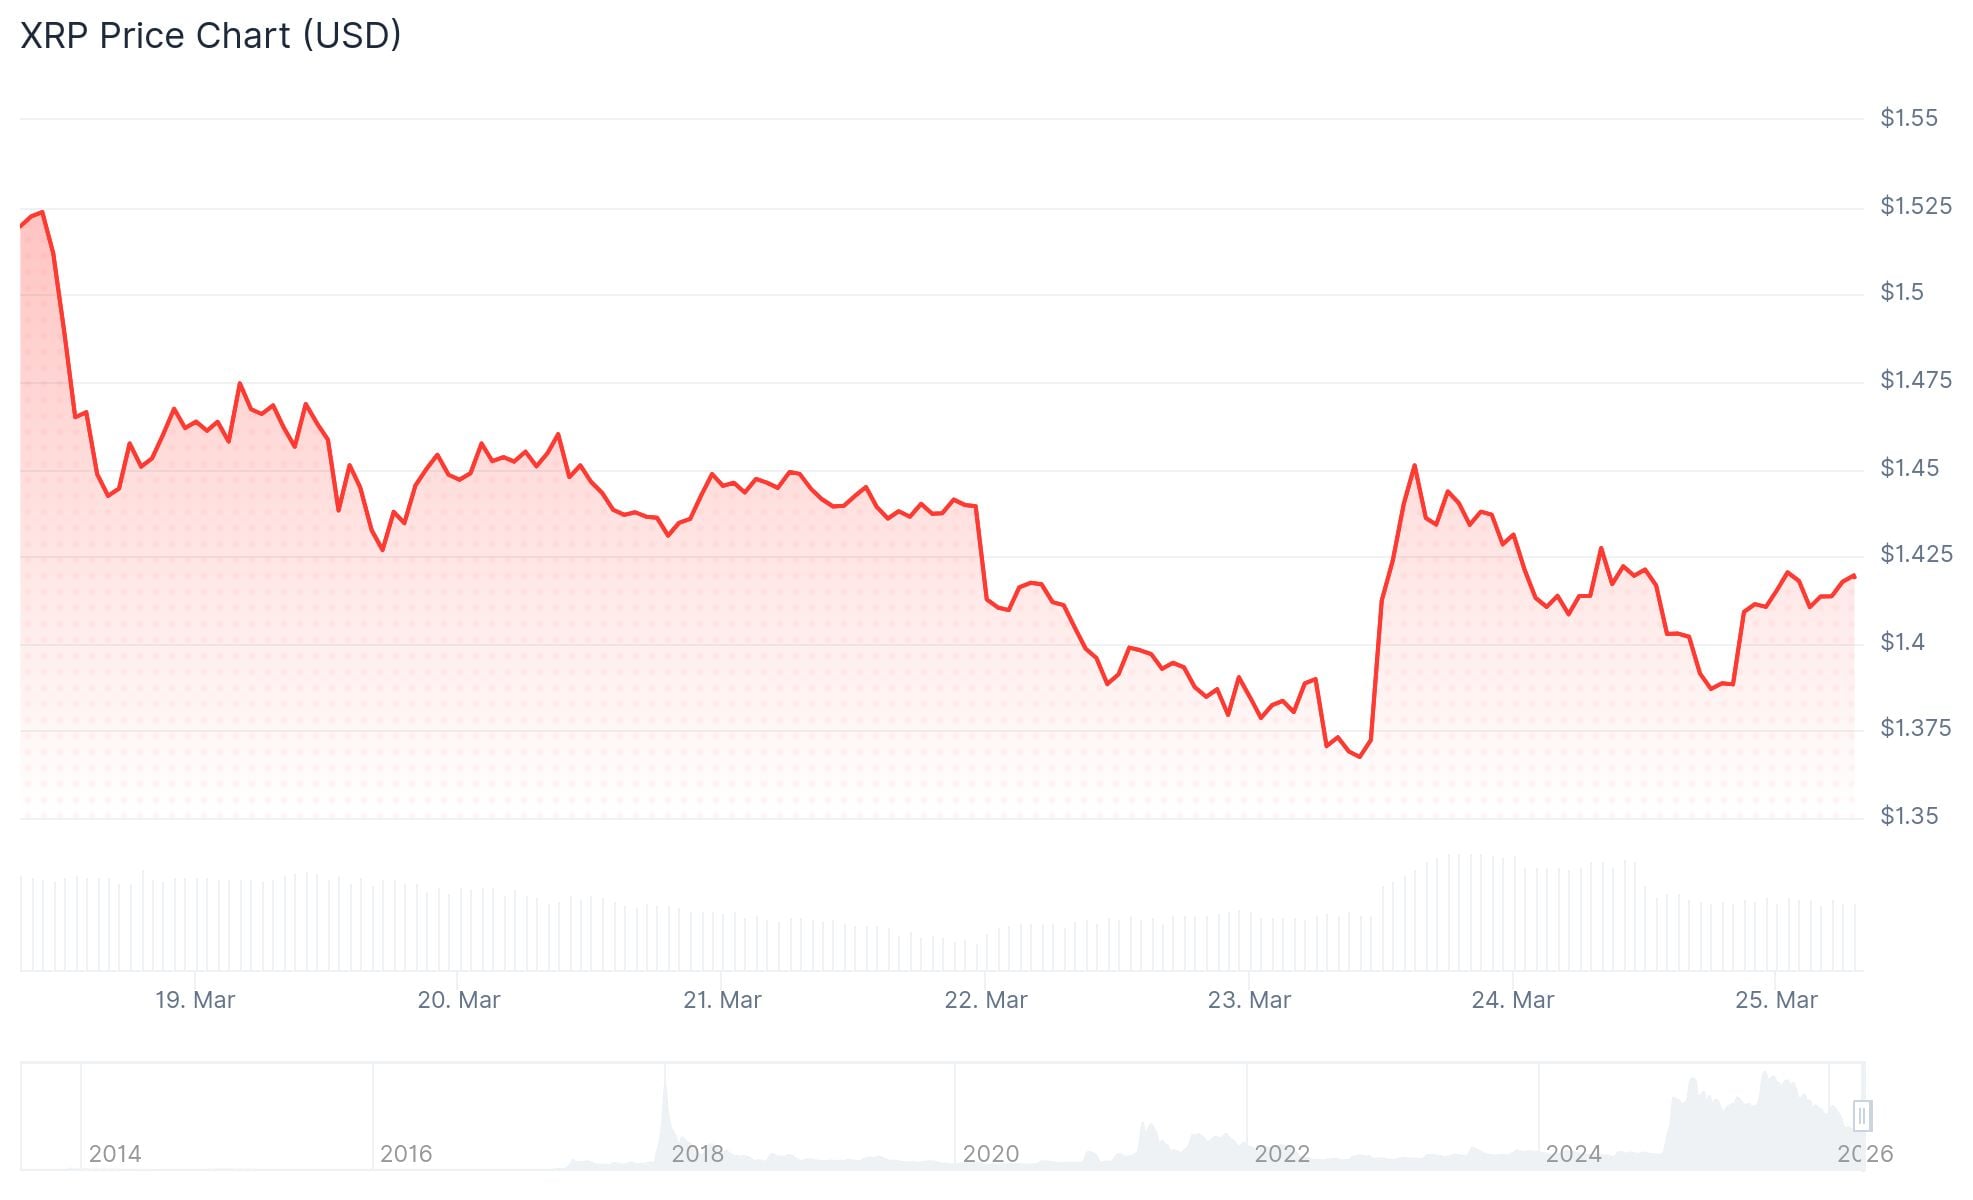
- XRP is trading at $1.39, down 3.46% in the last 24 hours
- Price is stabilizing at the $1.40 support level after a recent decline
- Breaking above $1.45–$1.50 resistance could signal a recovery
- RSI sits at 46, below the neutral 50 mark, reflecting weak momentum
- A drop below $1.3850 could push price toward $1.3620 or lower
XRP is holding around a key support level after a period of selling pressure. The price has pulled back from recent highs and is now consolidating near $1.40.
 XRP Price
At the time of writing, XRP is trading at $1.39. Trading volume sits at $3.16 billion and market cap is $85.87 billion, according to CoinMarketCap. The price has dropped 3.46% in the past 24 hours.
XRP recently pushed above $1.41 and $1.42 before hitting a high of $1.4650. After that, selling kicked in and the price slipped back below $1.45 and $1.44.
The price dipped below the 61.8% Fibonacci retracement of the move from $1.3612 to $1.4650. Buyers stepped in near $1.3850, around the 76.4% Fib level, stopping a deeper fall.
Crypto analyst BitGuru noted on March 24 that XRP is trading in what he called a key accumulation range. He said the price action follows a breakdown from a falling wedge pattern and that XRP appears to be building a base at $1.40.
Technical Indicators Point Cautious
The RSI is sitting at around 46, still below the neutral 50 level. That suggests selling pressure remains in control for now.
XRP is also trading below its 20-day moving average of $1.41 and well below the 200-day moving average at $2.09. The moving average ribbon shows a bearish setup.
The MACD lines are flat and sitting in negative territory. There is no bullish crossover yet, which means momentum has not shifted in favor of buyers.
Key Levels to Watch
On the upside, the first resistance is near $1.4250. A break above that opens the door to $1.44, then $1.4650.
A clear move above $1.4650 could target $1.50, then $1.5250. Bulls would need to hold above $1.4250 to keep any recovery on track.
If XRP fails to break higher, the first support is at $1.40. Below that sits $1.3850, then $1.3620.
A close below $1.3620 could push the price toward $1.35 or even $1.3320.
Analyst Ali Charts posted on X that a key trendline could offer a strong buying opportunity for XRP, pointing to the current support zone as a potential entry area.
XRP is currently trading above $1.40 and the 100-hourly Simple Moving Average, with price action suggesting a wait-and-see mood among traders.
The post XRP Price: Trendline Support and Accumulation Zone Signal Possible Buying Opportunity appeared first on CoinCentral.


You May Also Like

Q2 Market Insights: Bitcoin regains dominance in risk-averse environment, ETFs remain critical to market structure

Nebius Revenue Skyrockets 684%: Why the "Pennsylvania AI Factory" Is the New Frontier for AI Infrastructure


