Solana (SOL) Price: 30% Rally on the Table if Bulls Can Hold This One Level
TLDR
- SOL is trading around $89–$90, with bulls working to hold this key support level.
- A break above $90 could push the price toward $120, a potential 30% gain.
- Trading volumes rose 30% over the past month, briefly approaching $5 billion.
- On-chain transactions dropped 20% from a recent peak, showing weaker network activity.
- Analyst Crypto Patel points to a monthly bullish engulfing candle as the key signal to watch for a major rally.
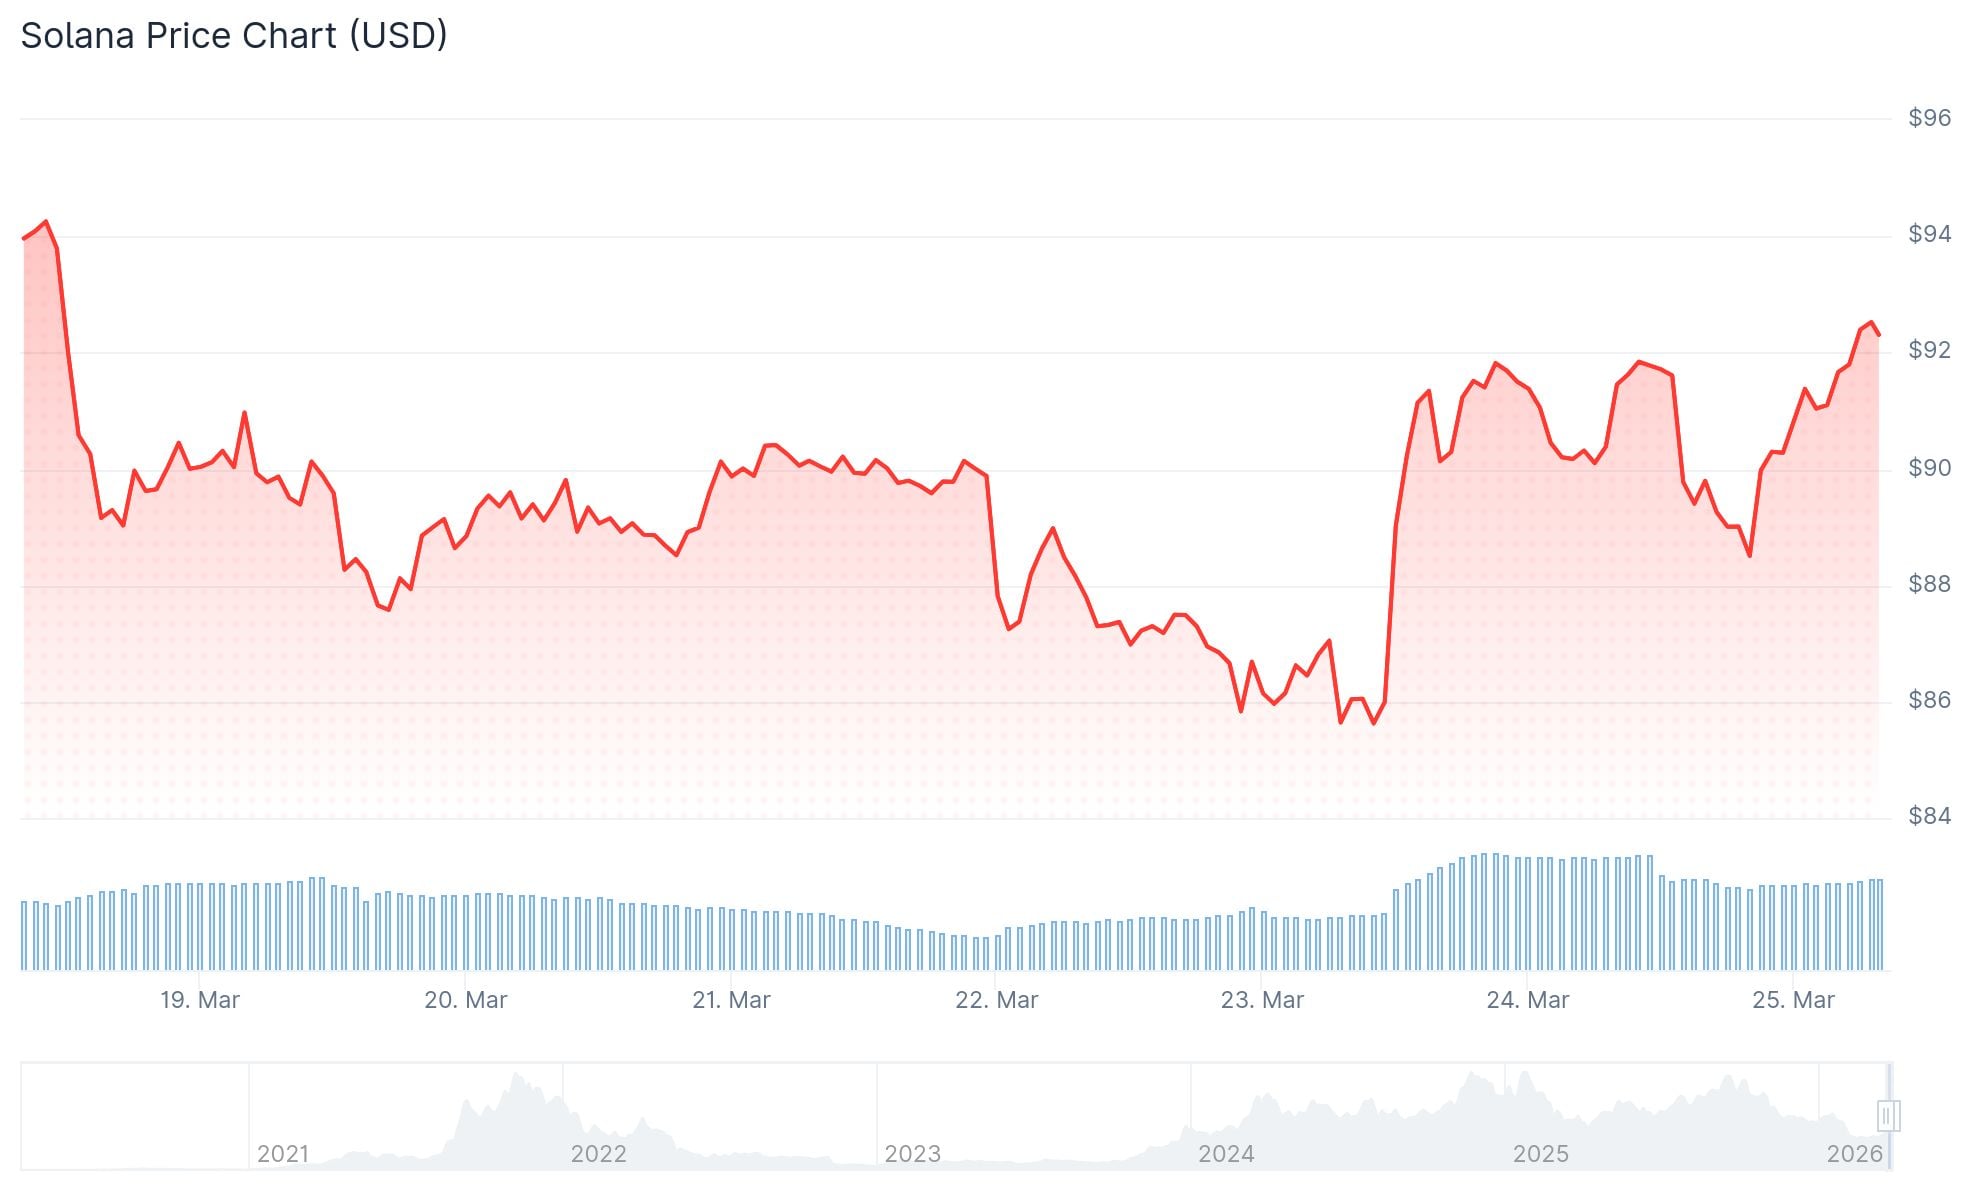
Solana is holding around the $90 mark as bulls and bears fight over this key price level. The coming days could decide whether SOL moves higher or pulls back toward lower support.
 Solana (SOL) Price
SOL has risen nearly 7% over the past month and is now hovering just below the $90 resistance zone. Trading volumes climbed 30% during this period, nearly hitting $5 billion, which equals about 10% of the token’s circulating market cap.
A decision by President Donald Trump to pause U.S. strikes on Iranian power plants helped lift crypto markets earlier this week. That move briefly pushed SOL above $90, but selling pressure has kept it from holding above that level.
Liquidation data shows over $370 million in short positions were wiped out during that brief push higher. If buyers can sustain upward pressure, a larger short squeeze could follow.
The daily chart shows the Relative Strength Index (RSI) sitting at 54, after briefly climbing above 60 last week. That suggests positive momentum is building but hasn’t yet broken out.
Key Price Levels to Watch
If SOL breaks $90 with conviction, the next target is $100, an 11% move. A sustained push beyond that could see the price reach $120, which would represent a 30% gain from current levels.
On the 4-hour chart, a buy signal appeared right as SOL touched $90, suggesting institutional buyers are active at that price. This is seen as confirmation that $90 holds technical importance.
If selling pressure increases instead, SOL could fall to $85 or even $80. The strength of any bearish momentum would determine how far a pullback goes.
On-Chain Data and Monthly Signal
On-chain data from Artemis shows total Solana transactions last week came in at 774 million. That’s a 20% drop from the recent record high, pointing to softer network usage.
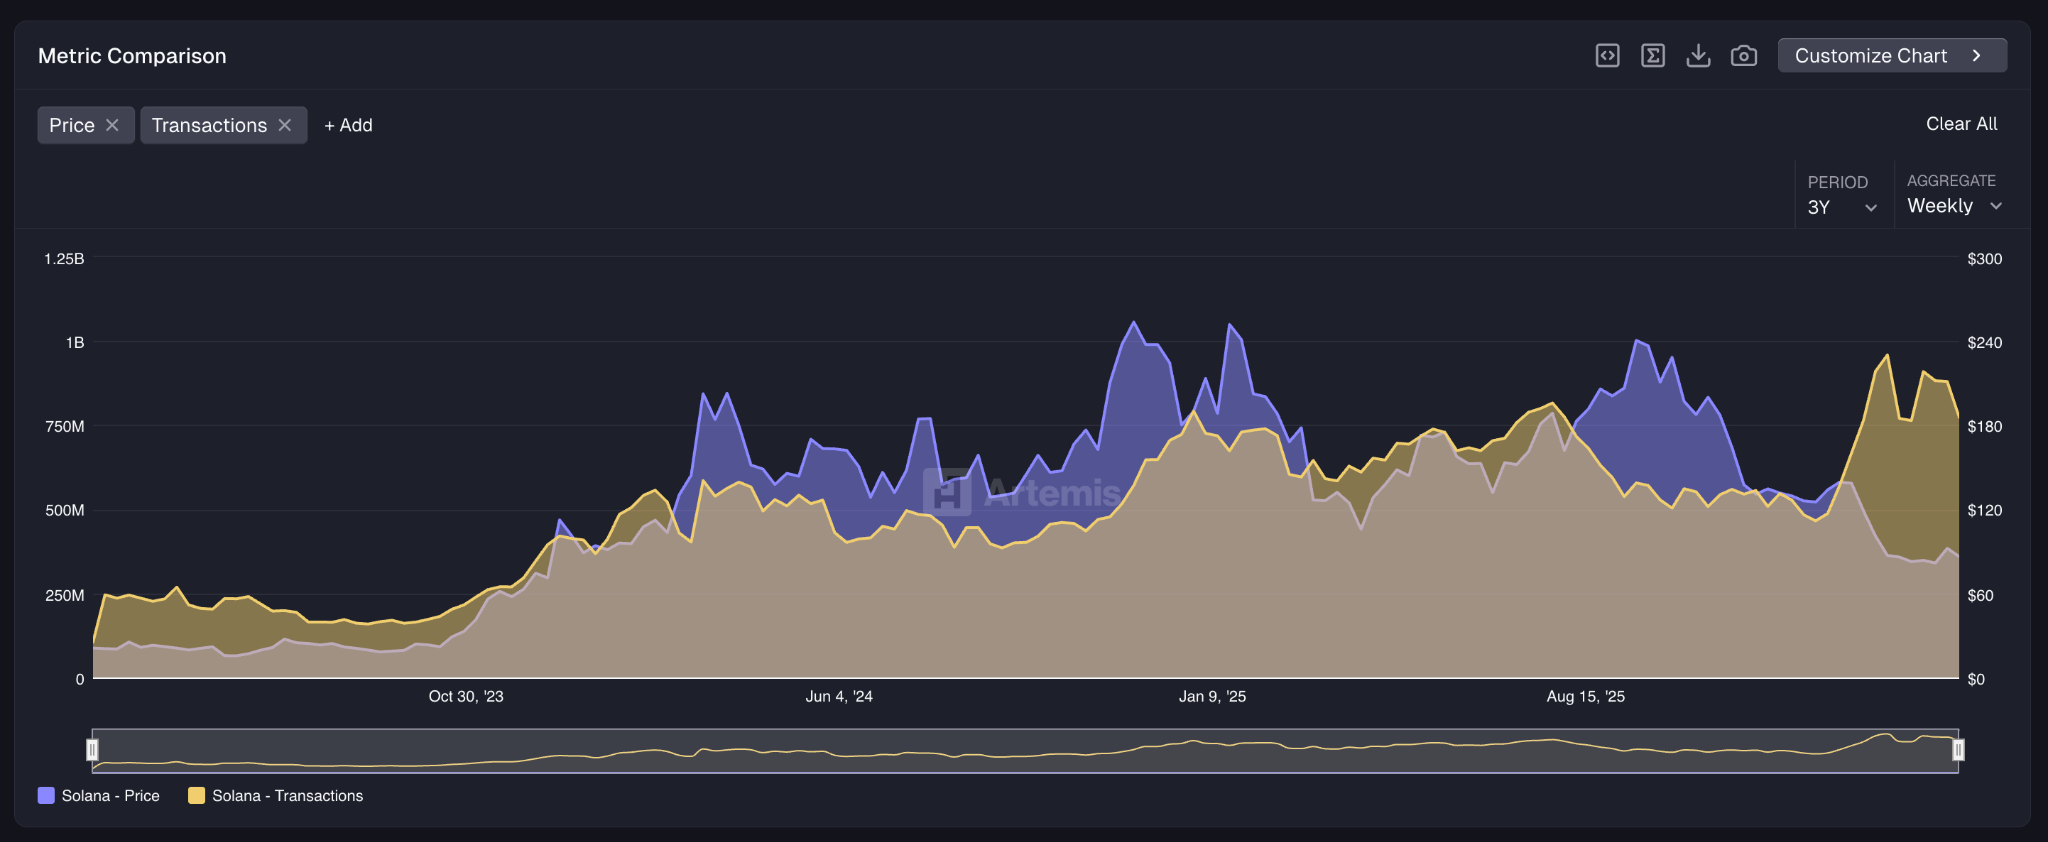 Source: Artemis
The Fear and Greed Index has recovered from a low of 5 to 46, showing investors are moving out of extreme fear, though sentiment remains cautious.
On the monthly chart, analyst Crypto Patel has highlighted a pattern worth watching. He notes that every major SOL rally has started with a monthly bullish engulfing candle.
Past examples include Solana rising from $1.03 to $260 in 2020 and from $8 to $296 in 2022. Patel says a similar candle in 2026 could push SOL to $1,000 or more.
Current technical indicators are mixed. The monthly RSI sits at 35.44, and SOL is trading below all major moving averages, including levels at $104, $111, $152, and $160.
The MACD line is at -1.26, below the signal line at -20.88, with a negative histogram, suggesting continued short-term pressure.
At the time of writing, SOL is priced at $89.33, with a 24-hour trading volume of $6.95 billion and a market cap of $51.64 billion.
The post Solana (SOL) Price: 30% Rally on the Table if Bulls Can Hold This One Level appeared first on CoinCentral.
You May Also Like

Top 15 AdTech Companies in India: 2026 Full Guide

Why Most Wix Websites Don’t Stand Out in Search & AI (And How Schema Fixes It)