The post FET Price Breakout Incoming? Whale Buying and OBV Flash Bullish Signal appeared first on Coinpedia Fintech News While most of the market remains distractedThe post FET Price Breakout Incoming? Whale Buying and OBV Flash Bullish Signal appeared first on Coinpedia Fintech News While most of the market remains distracted

FET Price Breakout Incoming? Whale Buying and OBV Flash Bullish Signal

2026/03/26 20:00
3 min read
For feedback or concerns regarding this content, please contact us at [email protected]
FET Bullish Divergence Hints at 45% Surge, Buy Signal

The post FET Price Breakout Incoming? Whale Buying and OBV Flash Bullish Signal appeared first on Coinpedia Fintech News

While most of the market remains distracted, FET’s on-chain data and technical indicators are aligning in a way that often precedes major breakouts. A recent multi-million dollar whale accumulation, combined with a strong signal from the On-Balance Volume (OBV) indicator, suggests that smart money may already be positioning. With price beginning to recover from its base and momentum slowly building, the big question now is, Is FET price about to surprise the market with a sharp upside rally?

Whale Accumulation Signals Growing Confidence

Fresh on-chain data reveals that a whale has accumulated 914 million FET tokens worth approximately $2.34 million from Binance, alongside additional altcoin purchases. Such large-scale accumulation typically reflects growing conviction among high-net-worth participants, especially when it occurs after a prolonged consolidation phase. Historically, whale buying at lower levels has often preceded strong upward moves, as large players tend to position early before momentum becomes obvious to the broader market. 

FET whale data

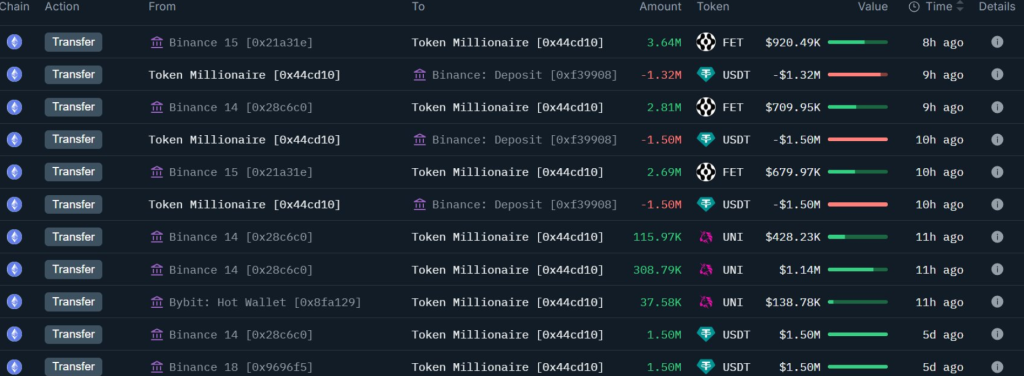
The timing of this accumulation suggests that institutional or smart money interest in FET may be increasing, particularly as AI-related narratives regain traction in the crypto space. This development is critical because it indicates that despite recent market uncertainty, capital is selectively flowing into high-potential assets, with FET emerging as one of the key beneficiaries.

OBV Indicator Flashes Bullish Divergence

Adding further weight to the bullish case is the behavior of the On-Balance Volume (OBV) indicator. According to market analysts, OBV is showing a steady rise even when price action has remained relatively subdued. This type of divergence is often interpreted as a leading signal of accumulation, where buying pressure builds beneath the surface before reflecting in price. In simpler terms, volume is increasing in favor of buyers, even though price has yet to fully respond.

FET price chart

Such setups have historically preceded strong breakouts, as latent demand eventually pushes price higher once resistance levels are tested. The current OBV structure suggests that FET may be in the early stages of this process.

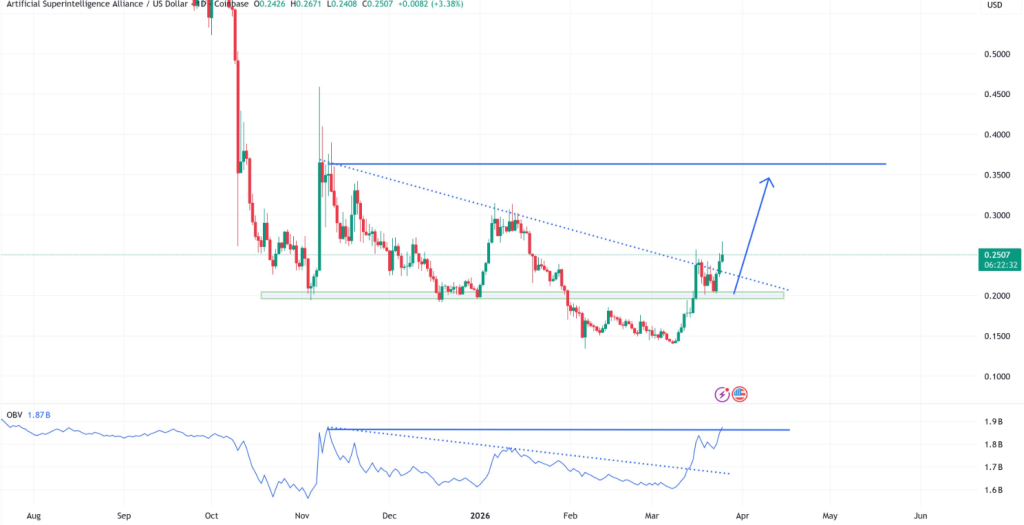
FET Price Action Points to Recovery Structure

FET price appears to be transitioning out of a downtrend into a recovery phase. The chart shows that price has formed a base and is now attempting to move higher, supported by improving momentum. A key observation is the formation of a higher low structure, indicating that selling pressure is gradually weakening. At the same time, price is approaching a critical resistance zone, which could act as the trigger point for the next major move.

If bulls manage to sustain momentum and break above this resistance, it could open the door for a sharp continuation toward higher levels, aligning with the signals observed in both on-chain data and volume indicators.

Key Levels to Watch

In the near term, immediate support is seen around the recent higher low region around $0.2200, which is acting as a foundation for the current recovery. Holding this level will be crucial to maintaining bullish structure. On the upside $0.2500, the primary resistance zone lies ahead, and a confirmed breakout above this level could accelerate momentum significantly toward $0.2700 followed by $0.2900. If this breakout occurs with strong volume confirmation, it may validate the ongoing accumulation narrative and trigger a broader rally.

Market Opportunity
FET Logo
FET Price(FET)
$0.2442
$0.2442$0.2442
+1.45%
USD
FET (FET) Live Price Chart
Disclaimer: The articles reposted on this site are sourced from public platforms and are provided for informational purposes only. They do not necessarily reflect the views of MEXC. All rights remain with the original authors. If you believe any content infringes on third-party rights, please contact [email protected] for removal. MEXC makes no guarantees regarding the accuracy, completeness, or timeliness of the content and is not responsible for any actions taken based on the information provided. The content does not constitute financial, legal, or other professional advice, nor should it be considered a recommendation or endorsement by MEXC.

You May Also Like

Nvidia Faces Class Action Over Alleged Hidden Crypto GPU Revenue

Nvidia Faces Class Action Over Alleged Hidden Crypto GPU Revenue

Nvidia faces class action over alleged $1B undisclosed crypto GPU revenue; investors gain approval to proceed as a group. Nvidia faces a certified class action
Share
LiveBitcoinNews2026/03/27 02:30
Ethereum koers toont zeldzaam dubbel koopsignaal en richt zich op $4.550

Ethereum koers toont zeldzaam dubbel koopsignaal en richt zich op $4.550

Connect met Like-minded Crypto Enthusiasts! Connect op Discord! Check onze Discord   Ethereum laat op de uurgrafiek twee opeenvolgende TD Sequential koopsignalen zien. Deze indicator meet uitputting in een trend en geeft vaak een signaal dat de verkoopdruk kan afnemen. Dit dubbele signaal verschijnt rond het niveau van $4.516, waar de ETH prijs kortstondig steun vindt. Dit type formatie komt zelden voor en wordt daarom extra nauwlettend gevolgd. Wat gaat de Ethereum koers hiermee doen? Ethereum koers test steun rond $4.516 De scherpe daling van de Ethereum koers vanaf de prijszone rond $4.800 bracht de ETH prijs in korte tijd naar ongeveer $4.516. Op dit niveau trad duidelijke koopactiviteit op, waardoor de neerwaartse beweging tijdelijk werd gestopt. Het dubbele signaal dat door de TD Sequential indicator is gegenereerd, viel precies samen met dit prijspunt. De TD Sequential is opgebouwd uit negen candles die een trend meetellen. Wanneer de negende candle verschijnt, kan dit duiden op een trendomslag. In dit geval verschenen zelfs twee signalen kort na elkaar, wat aangeeft dat de verkoopdruk mogelijk uitgeput is. Het feit dat dit gebeurde in een zone waar ETH kopers actief bleven, maakt het patroon extra opvallend. TD Sequential just flashed two buy signals for Ethereum $ETH! pic.twitter.com/JPO8EhiEPi — Ali (@ali_charts) September 16, 2025 Welke crypto nu kopen?Lees onze uitgebreide gids en leer welke crypto nu kopen verstandig kan zijn! Welke crypto nu kopen? Fed-voorzitter Jerome Powell heeft aangekondigd dat de rentes binnenkort zomaar eens omlaag zouden kunnen gaan, en tegelijkertijd blijft BlackRock volop crypto kopen, en dus lijkt de markt klaar om te gaan stijgen. Eén vraag komt telkens terug: welke crypto moet je nu kopen? In dit artikel bespreken we de munten die… Continue reading Ethereum koers toont zeldzaam dubbel koopsignaal en richt zich op $4.550 document.addEventListener('DOMContentLoaded', function() { var screenWidth = window.innerWidth; var excerpts = document.querySelectorAll('.lees-ook-description'); excerpts.forEach(function(description) { var excerpt = description.getAttribute('data-description'); var wordLimit = screenWidth wordLimit) { var trimmedDescription = excerpt.split(' ').slice(0, wordLimit).join(' ') + '...'; description.textContent = trimmedDescription; } }); }); Technische indicatoren schetsen herstelkans voor ETH Naast de dubbele koopsignalen verstrekken ook andere indicatoren belangrijke aanwijzingen. Tijdens de daling van de ETH koers waren grote rode candles zichtbaar, maar na de test van $4.516 stabiliseerde de Ethereum koers. Dit wijst op een mogelijke verschuiving in het evenwicht tussen de bears en bulls. Als deze opwaartse beweging doorzet, liggen de eerste weerstanden rond $4.550. Daarboven wacht een sterkere zone rond $4.650. Deze niveaus zijn in eerdere Ethereum sessies al meerdere keren getest. Een doorbraak zou ruimte openen richting de all-time high van ETH rond $4.953. Wanneer de prijs toch opnieuw onder $4.516 zakt, liggen er zones rond $4.500 en $4.450 waar grotere kooporders worden verwacht. Deze niveaus kunnen als een vangnet fungeren, mocht de druk opnieuw toenemen. Marktdynamiek bevestigt technische indicatoren De huidige situatie volgt op een bredere correctie in de cryptomarkt. Verschillende vooraanstaande crypto tokens zagen scherpe koersdalingen, waarna traders op zoek gingen naar signalen voor een mogelijke ommekeer. Dat juist Ethereum nu een dubbel TD Sequential signaal toont, versterkt de interesse in dit scenario. Fundamenteel blijft Ethereum sterk. Het aantal ETH tokens dat via staking is vastgezet, blijft groeien. Dat verkleint de vrije circulatie en vermindert verkoopdruk. Tegelijk blijft het netwerk intensief gebruikt voor DeFi, NFT’s en stablecoins. Deze activiteiten zorgen voor een stabiele vraag naar ETH, ook wanneer de prijs tijdelijk onder druk staat. Fundamentele drijfveren achter de Ethereum koers De Ethereum koers wordt echter niet alleen bepaald door candles en patronen, maar ook door bredere factoren. Een stijgend percentage van de totale ETH supply staat vast in staking contracten. Hierdoor neemt de liquiditeit op exchanges af. Dit kan prijsschommelingen versterken wanneer er plotseling meer koopdruk ontstaat. Daarnaast is Ethereum nog steeds het grootste smart contract platform. Nieuwe standaarden zoals ERC-8004 en ontwikkelingen rond layer-2 oplossingen houden de activiteit hoog. Deze technologische vooruitgang kan de waardepropositie ondersteunen en zo indirect bijdragen aan een ETH prijsherstel. Het belang van de korte termijn dynamiek De komende handelsdagen zullen duidelijk maken of de bulls genoeg kracht hebben om door de weerstandszone rond $4.550 te breken. Voor de bears ligt de focus juist op het verdedigen van de prijsregio rond $4.516. De whales, die met grote handelsorders opereren, kunnen hierin een beslissende rol spelen. Het dubbele TD Sequential signaal blijft hoe dan ook een zeldzame gebeurtenis. Voor cryptoanalisten vormt het een objectief aanknopingspunt om de kracht van de huidige Ethereum trend te toetsen. Vooruitblik op de ETH koers Ethereum liet twee opeenvolgende TD Sequential signalen zien op de uurgrafiek, iets wat zelden voorkomt. Deze formatie viel samen met steun rond $4.516, waar de bulls actief werden. Als de Ethereum koers boven dit niveau blijft, kan er ruimte ontstaan richting $4.550 en mogelijk $4.650. Zakt de prijs toch opnieuw onder $4.516, dan komen $4.500 en $4.450 in beeld als nieuwe steunzones. De combinatie van zeldzame indicatoren en een sterke fundamentele basis maakt Ethereum interessant voor zowel technische als fundamentele analyses. Of de bulls het momentum echt kunnen overnemen, zal blijken zodra de Ethereum koers de eerstvolgende weerstanden opnieuw test. Koop je crypto via Best Wallet Best wallet is een topklasse crypto wallet waarmee je anoniem crypto kan kopen. Met meer dan 60 chains gesupport kan je al je main crypto coins aanschaffen via Best Wallet. Best wallet - betrouwbare en anonieme wallet Best wallet - betrouwbare en anonieme wallet Meer dan 60 chains beschikbaar voor alle crypto Vroege toegang tot nieuwe projecten Hoge staking belongingen Lage transactiekosten Best wallet review Koop nu via Best Wallet Let op: cryptocurrency is een zeer volatiele en ongereguleerde investering. Doe je eigen onderzoek. Het bericht Ethereum koers toont zeldzaam dubbel koopsignaal en richt zich op $4.550 is geschreven door Dirk van Haaster en verscheen als eerst op Bitcoinmagazine.nl.
Share
Coinstats2025/09/17 23:31
Next-Gen Payments, Prediction Markets, and the Future of US iGaming Infrastructure

Next-Gen Payments, Prediction Markets, and the Future of US iGaming Infrastructure

Payments infrastructure is quietly becoming one of the most important battlegrounds in digital finance.  It rarely gets the same attention as user interfaces or
Share
Techbullion2026/03/27 01:59