

Bitcoin Enters Reset Period After Pullback From Highs
Bitcoin has fallen roughly 47% from its October 2025 all-time high near $126,000 and entered what analysts are calling a “reset period.” With leverage flushed, valuations compressed to historically low multiples, and extreme fear gripping the market, the correction increasingly resembles a structural clearing event rather than a trend reversal, setting up multiple consolidation phases that could precede the next major price move.
Bitcoin Pulls Back From Highs and Enters a Reset Period
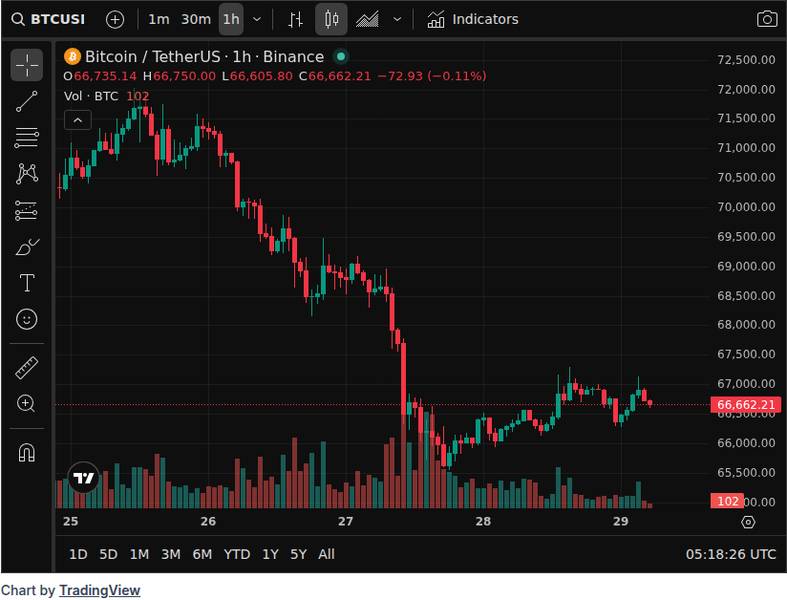
Bitcoin reached an all-time high of $126,080 on October 6, 2025. Since then, a prolonged repricing has dragged the asset down to approximately $66,660 at press time, a decline of over 47% from the peak.
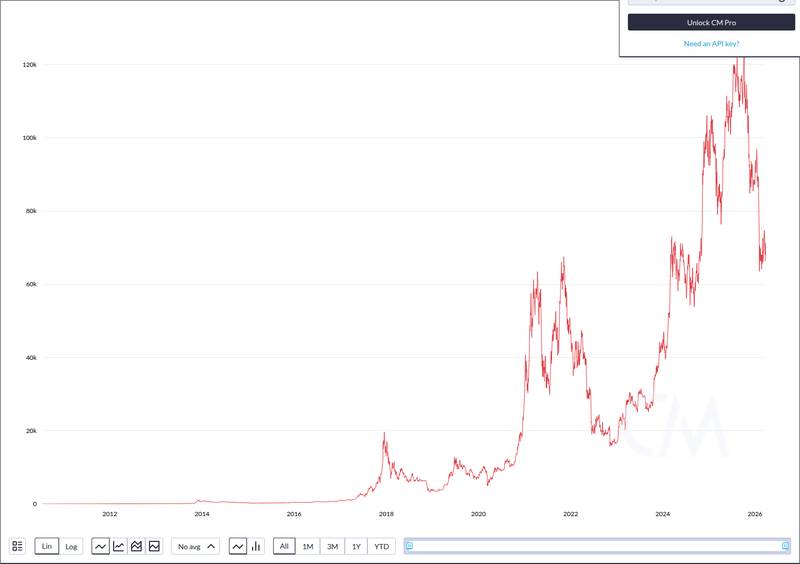
 CoinGecko chart illustrating Bitcoin’s price trajectory from its October 2025 peak through the Q1 2026 correction.
Year-to-date, Bitcoin is down 23.7% in 2026. The Crypto Fear & Greed Index has plunged to 9 out of 100, deep in “Extreme Fear” territory, a reading that historically coincides with capitulation phases rather than sustained selling.
What distinguishes a “reset period” from a breakdown is the nature of the deleveraging. On March 27, $300 million in Bitcoin long positions were liquidated in a single session, driving BTC to a two-week low. That kind of forced selling clears speculative excess and brings the market closer to a clean structural base.
Luke Deans, senior research associate at Bitwise, framed the dynamic directly: Bitcoin started repricing months before traditional risk assets caught up.
The S&P 500, by contrast, has only lost roughly 8% over the past month. Bitcoin’s repricing began five months earlier, from its October 2025 highs, suggesting digital assets front-ran the macro tightening that equities are only now absorbing.
Multiple Consolidation Phases Are Building Beneath the Surface
The reset is not a single sideways range. Two distinct structural phases are visible in the an initial deleveraging phase from October 2025 through early 2026 that took Bitcoin from $126,000 to roughly $60,000, followed by a stabilization phase in which BTC has bounced and compressed into the $66,000-$74,000 corridor.
The Mayer Multiple, which measures Bitcoin’s spot price relative to its 200-day moving average, has sat in the lower percentiles of its historical range since January 2026. This sustained valuation compression signals that the market has been systematically resetting expectations, not just experiencing a brief dip.
 CoinMetrics blockchain-data panel highlighting the structural trend discussed for bitcoin.
On-chain data from Glassnode’s Week 11 report reinforces the consolidation thesis. Supply in profit has stabilized at approximately 60%, ETF inflows have turned positive, and perpetual funding rates remain negative, indicating crowded short positioning that could fuel a squeeze if sentiment shifts.
The negative funding rates are particularly notable. When the derivatives market is heavily short while spot demand holds steady, it creates a coiled-spring dynamic. The massive long liquidation event on March 27 already cleared one side of the leverage equation; the short side remains exposed.
Macro headwinds explain why the consolidation has stretched. Prediction markets including Polymarket and Kalshi now price a roughly 40% probability that the Federal Reserve makes zero rate cuts in 2026, up from under 3% earlier in the year. Geopolitical unrest, particularly the US-Iran conflict disrupting Strait of Hormuz energy flows, has pushed inflation expectations higher, making rate relief less likely in the near term.
In other words, Bitcoin may have already absorbed the worst of the blow. The S&P 500, still closer to its cyclical highs, arguably has more room to fall if macro conditions deteriorate further. The growing divergence between stablecoin market activity and spot crypto prices suggests capital is sitting on the sidelines, waiting for a catalyst.
What History Says About Bitcoin’s Consolidation Periods Before New Highs
Multi-phase consolidation patterns have preceded every major Bitcoin rally in recent cycles. The most relevant analogue is the mid-2021 correction, when Bitcoin fell roughly 55% from its April high near $64,000 to $29,000, consolidated in a tight range for three months, then broke out to a new all-time high of $69,000 by November.
The current structure shares key similarities. Bitcoin’s 47% drawdown from the October 2025 peak mirrors the magnitude of that 2021 correction. The Mayer Multiple’s sustained compression into lower historical percentiles echoes the same bottoming signal that preceded the late-2021 breakout. Both periods featured extreme fear readings and heavy deleveraging before the turn.
Some analysts have suggested 2026 could follow a “multi-stage recovery” pattern, with the early-year deleveraging giving way to a mid-year rebound and then a second consolidation before any sustainable uptrend, according to unconfirmed reports from market commentators. While this framing is speculative, the structural parallels with prior cycles lend it some credibility.
Bitcoin’s market cap still stands at $1.33 trillion with a circulating supply of 20,008,518 BTC, representing 95.3% of its maximum supply. The shrinking new-supply dynamic that the April 2024 halving set in motion continues to tighten the structural backdrop with each passing month.
Meanwhile, the broader regulatory landscape continues to evolve in ways that could shape the next phase. Developments like the ongoing tension between pro-crypto rhetoric and enforcement actions add another layer of uncertainty for institutional allocators weighing re-entry.
For traders and analysts watching this reset period, the concrete watchpoints are clear. A sustained break above the 200-day moving average, which would push the Mayer Multiple back above 1.0, would be the first technical confirmation that the consolidation phase is ending. A flip in perpetual funding rates from negative to positive would signal the short-heavy positioning has been cleared. And any shift in Fed rate expectations, particularly a move below 30% probability of zero cuts, could provide the macro catalyst this market is waiting for.
Disclaimer: This article is for informational purposes only and does not constitute financial or investment advice. Cryptocurrency and digital asset markets carry significant risk. Always do your own research before making decisions.


You May Also Like

Teacher accuses MAGA superintendent of working with Libs of TikTok to destroy his career
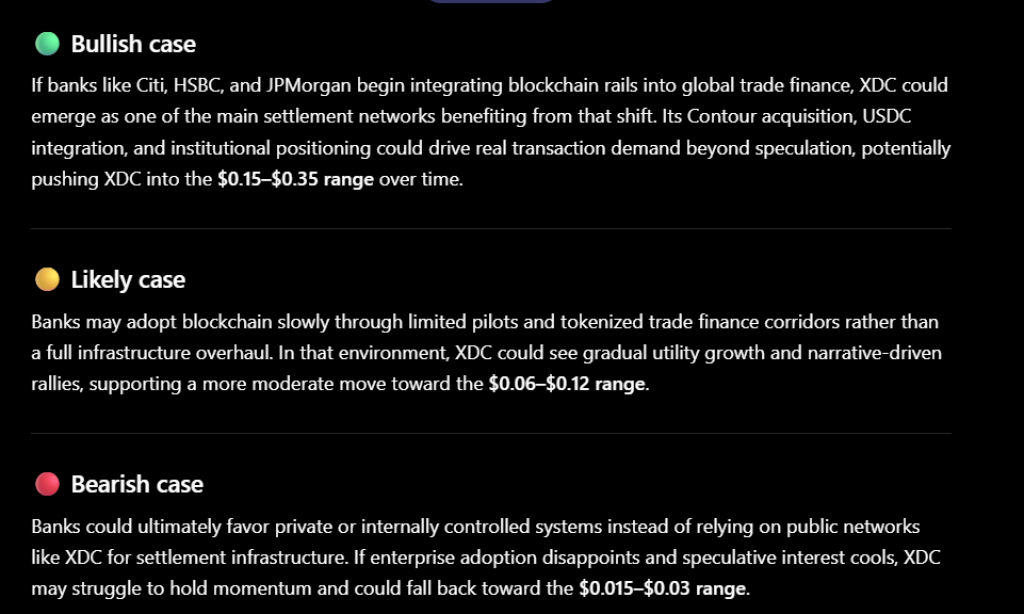
ChatGPT Predicts XDC Network Price if Banks Finally Upgrade the “Plumbing” Behind Global Trade Finance


