

S&P 500 Futures Plunge: Stark Seven-Month Lows as US-Iran Uncertainty Intensifies
BitcoinWorld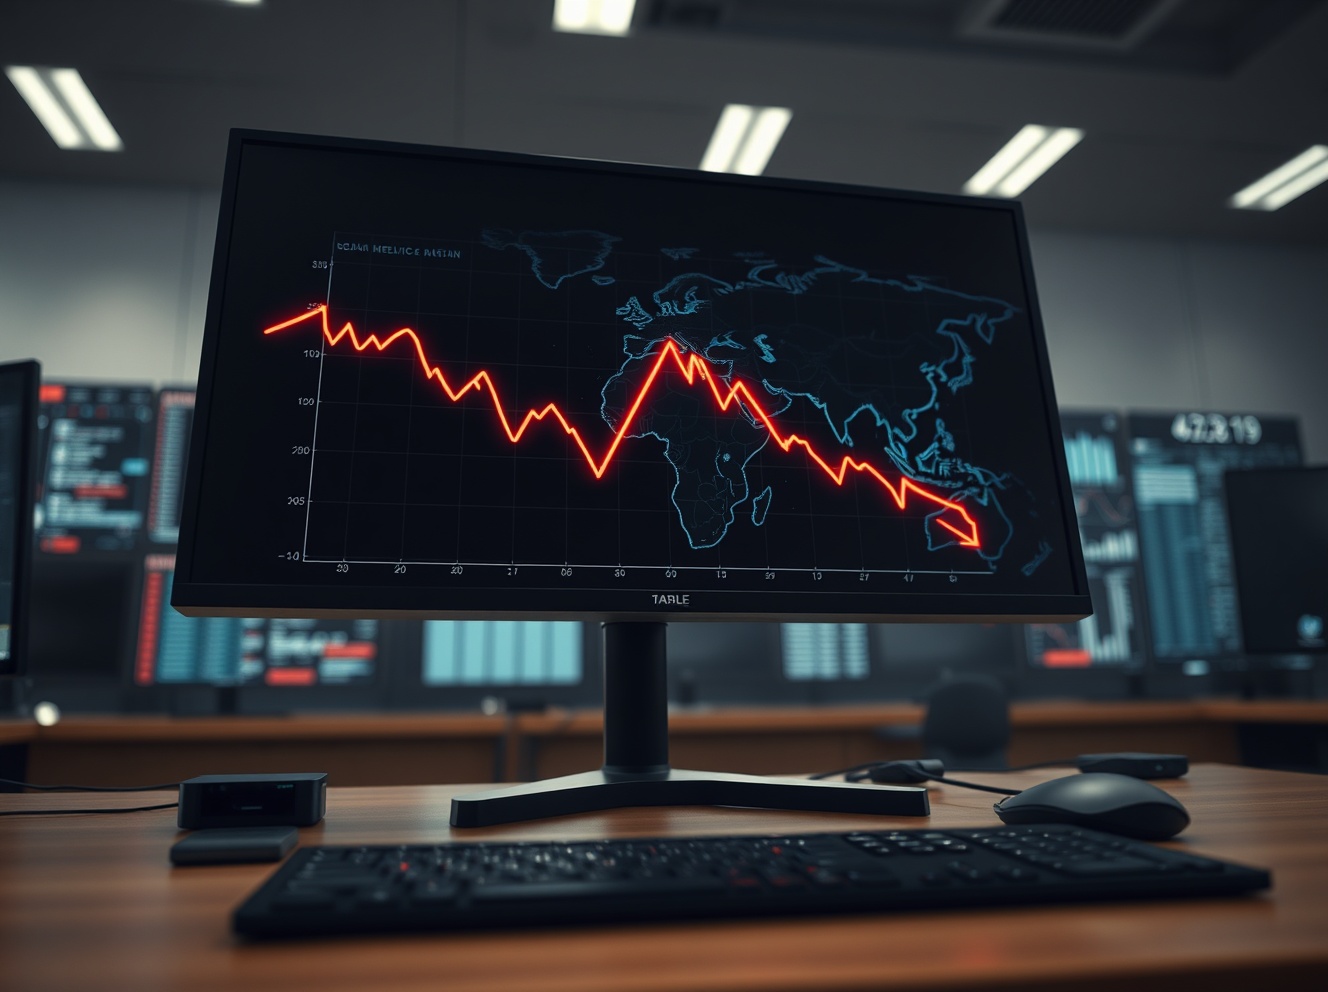
S&P 500 Futures Plunge: Stark Seven-Month Lows as US-Iran Uncertainty Intensifies
NEW YORK, April 2025 – S&P 500 index futures contracts tumbled sharply in overnight trading, hitting their lowest level in seven months. This significant drop reflects deepening investor anxiety over escalating geopolitical tensions between the United States and Iran. Consequently, traders are rapidly pricing in heightened risk, leading to a broad-based retreat from equity markets.
S&P 500 Futures Chart a Steep Decline
The benchmark E-mini S&P 500 futures contract fell decisively below a critical technical support level. Market data shows the contract trading near 4,150 points, a zone not seen since September 2024. This movement represents a decline of over 8% from the index’s recent peak. Furthermore, trading volume spiked significantly above the 30-day average, indicating forceful selling pressure. Analysts immediately identified the primary catalyst.
Key technical levels breached include:
- The 200-day moving average, a major long-term trend indicator
- Psychological support at the 4,200-point level
- The late-2024 consolidation range, now acting as resistance
This chart action signals a potential shift in market structure from a correction to a more sustained downtrend. Historically, breaks of this magnitude during periods of geopolitical stress have preceded extended volatility.
Deepening US-Iran Uncertainty Drives Sell-Off
The immediate trigger for the futures plunge was a series of diplomatic statements and military movements reported late Tuesday. U.S. officials reiterated a firm stance on Iranian nuclear activities. Simultaneously, Iranian state media broadcast military exercises in the Strait of Hormuz, a vital global oil chokepoint. This exchange marks the most tense interaction between the nations in nearly two years.
Market participants are assessing several concrete risks. First, a potential disruption to oil shipments through the Strait could trigger an energy price shock. Second, the prospect of expanded sanctions threatens global supply chains. Third, the uncertainty paralyzes corporate investment decisions. “Markets abhor uncertainty, and this situation presents a textbook case,” noted a senior strategist at a global investment bank, speaking on background. “The lack of a clear diplomatic off-ramp is forcing a wholesale re-pricing of risk assets.”
Historical Context and Market Memory
Financial markets possess a long memory regarding Middle East volatility. For instance, similar tensions in early 2020 contributed to a sharp, albeit brief, equity market correction. However, the current macroeconomic backdrop differs substantially. Presently, central banks are less able to provide aggressive stimulus due to persistent inflation concerns. This constraint amplifies the perceived impact of geopolitical shocks on asset prices. Analysis of options market data reveals a surge in demand for protective puts on the SPDR S&P 500 ETF (SPY), with traders paying a premium for downside protection not seen since 2022.
Broader Market Impacts and Sector Analysis
The sell-off was not isolated to broad index futures. Nasdaq 100 futures underperformed, dropping over 2.5% in the session. This suggests a pronounced flight from growth-oriented technology stocks. Conversely, traditional safe-haven assets witnessed inflows. U.S. Treasury futures rallied, pushing the yield on the 10-year note down by 12 basis points. Additionally, gold futures broke above $2,400 per ounce, extending a rally that began weeks prior.
A sector-by-sector analysis reveals a clear risk-off pattern:
| Sector | Performance (Relative to S&P 500) | Primary Driver |
|---|---|---|
| Energy | Mixed/Volatile | Oil price spike vs. demand destruction fears |
| Technology | Significant Underperformance | High valuation sensitivity to rising discount rates |
| Utilities & Consumer Staples | Relative Outperformance | Defensive characteristics and stable dividends |
| Financials | Underperformance | Flattening yield curve and economic concern |
This rotation indicates investors are not merely taking profits but are actively repositioning portfolios for a more hostile economic environment. The VIX volatility index, often called the “fear gauge,” jumped above 30, confirming the spike in expected near-term market swings.
Global Ripple Effects and Central Bank Watch
Asian and European equity markets opened sharply lower in response to the U.S. futures action. Japan’s Nikkei 225 fell 2.1%, while Germany’s DAX index dropped 1.8% in early trading. The MSCI All-Country World Index futures pointed to a deeply negative global open. Currency markets also reacted, with the U.S. Dollar Index (DXY) strengthening as investors sought dollar liquidity—a typical pattern during global risk aversion.
Central banks now face a complex dilemma. The Federal Reserve and other major institutions must balance their inflation-fighting mandates against the potential for a geopolitical shock to slow economic growth. Upcoming policy meeting communications will be scrutinized for any mention of geopolitical risks as a factor in their decision-making. Historically, central banks have paused tightening cycles or provided liquidity during acute crisis periods, but the current high-inflation environment reduces that flexibility.
Expert Insight on Investor Psychology
Dr. Anya Sharma, a professor of behavioral finance, explains the market mechanics. “When faced with unquantifiable geopolitical risk, the rational response for a diversified portfolio manager is to reduce overall exposure,” she states. “This creates a self-reinforcing cycle. Selling begets more selling as stop-loss orders are triggered and risk models force deleveraging. The key for stability will be whether the diplomatic channel remains open, providing a potential ceiling for the fear.”
Conclusion
The plunge in S&P 500 futures to seven-month lows serves as a stark indicator of the financial market’s acute sensitivity to the deepening US-Iran uncertainty. This event underscores the fragile equilibrium in global markets, where geopolitical flashpoints can rapidly override fundamental economic data. The path forward for equities will heavily depend on the evolution of diplomatic efforts and the subsequent response from corporate leaders and policymakers. Investors are now navigating a landscape where geopolitical risk premia have expanded significantly, demanding greater caution and strategic hedging.
FAQs
Q1: What are S&P 500 futures and why do they matter?
S&P 500 futures are financial contracts that allow investors to bet on or hedge against the future value of the S&P 500 stock index. They trade nearly 24 hours a day and are a critical real-time barometer of market sentiment, often predicting the direction of the regular stock market session.
Q2: How do US-Iran tensions specifically affect the stock market?
Tensions raise fears of regional conflict that could disrupt global oil supplies, triggering inflation and slowing economic growth. They also create uncertainty that causes businesses to delay investments and consumers to pull back spending, negatively impacting corporate earnings forecasts.
Q3: Is this a good time to buy stocks during a geopolitical sell-off?
Market timing is extremely difficult. While some investors see sell-offs as buying opportunities, catching a “falling knife” is risky. Most financial advisors recommend maintaining a long-term, diversified strategy rather than making drastic moves based on headlines.
Q4: What other assets typically perform well when stocks fall on geopolitical news?
Traditional safe havens often see inflows. These include U.S. Treasury bonds, gold, the Swiss franc, and, at times, the U.S. dollar. Certain defensive stock sectors like utilities and consumer staples may also hold up better.
Q5: How long do markets usually remain volatile after a geopolitical shock?
The duration varies widely. Sharp sell-offs can be short-lived if a crisis de-escalates quickly, as seen in many past events. However, if tensions persist and evolve into a sustained threat with economic consequences (like prolonged oil embargoes), volatility and risk aversion can last for months.
This post S&P 500 Futures Plunge: Stark Seven-Month Lows as US-Iran Uncertainty Intensifies first appeared on BitcoinWorld.
You May Also Like

Cryptos Signal Divergence Ahead of Fed Rate Decision
Is Pepeto The Best Crypto Investment Over Dogecoin And Pepe Coin? All Signs Point To : YES


