

Why JuCoin Price Crashed 70% Today?

The post Why JuCoin Price Crashed 70% Today? appeared first on Coinpedia Fintech News
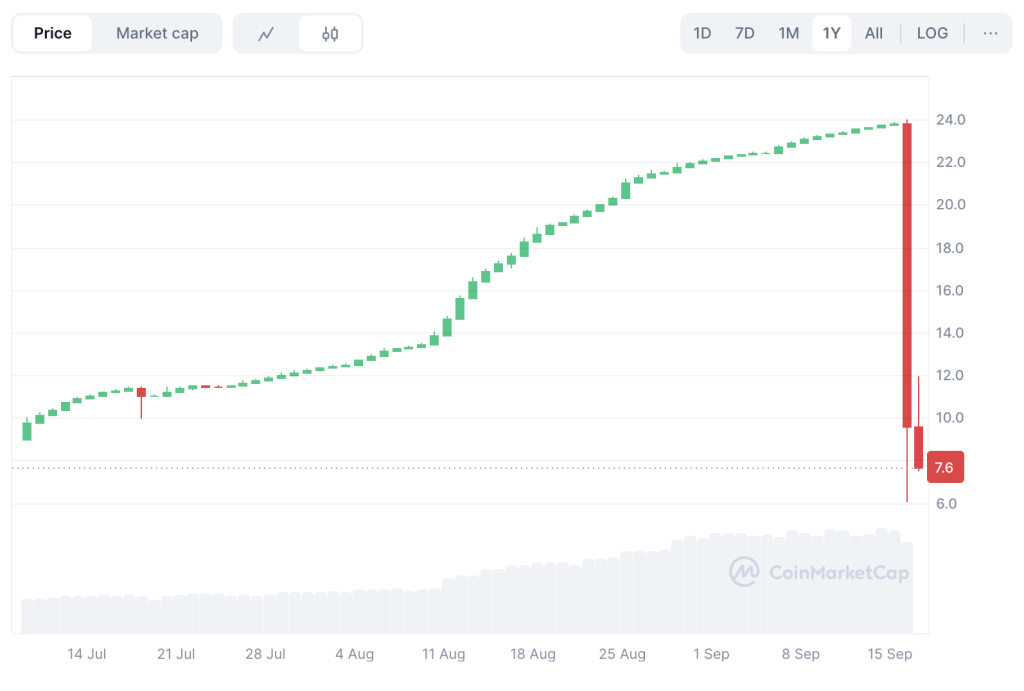
The crypto market never fails to surprise, and this time it was JuCoin’s turn in the spotlight. The platform’s native token, JU, shocked traders when its price suddenly dropped from a high of $24 to $7 in just a few minutes.
That’s a stunning 70% crash that has shaken investor confidence and wiped billions from its market cap.
$1 Billion Sell-Off and Liquidations
JU token markets were shaken by a wave of heavy sell orders and liquidations that quickly dragged prices lower. In just one day, more than $1.39 billion worth of JU was traded, as holders rushed for the exits in reaction to mounting regulatory scrutiny.
The panic didn’t stop there. JU’s 24-hour trading volume dropped by 23.9% to $1.03 billion, showing how quickly demand dried up once fear took over.
At the same time, the token’s turnover ratio jumped to 7.24, a clear signal of sharp volatility in an already fragile, low-liquidity environment.
Analysts note that the spike in JU’s unusual trading activity looks abnormal compared to Bitcoin or Ethereum. Such unstable swings hint at possible manipulation and raise doubts about JU’s long-term stability.
JuCoin’s quick response
Not long after the incident, JuCoin stepped in with a public statement. The team insisted that all operations are running as usual and, most importantly, that users’ funds are safe.
They explained that business functions remain unaffected, trying to calm fears of a deeper problem. Although the exchange didn’t provide clear details about what triggered the collapse.
Ju Token Technical Analysis
After dropping to $7, attention now turns to whether it can stay above the yearly low of $6.03. Some traders see room for a small rebound after the steep fall, but the overall market mood is still weak.
The RSI shows oversold levels, which often signal panic selling. At the same time, the MACD histogram has turned negative (-0.17), confirming a loss of momentum and a stronger bearish trend.
For now, a close above $9.87 could spark a short-lived bounce, often called a “dead-cat bounce.” But analysts warn that a real recovery can only happen if JU climbs back to $15 and holds that level.


You May Also Like

Gold price in India: Rates on April 13

Strategy signals another bitcoin buy as company needs just 2% annual BTC growth to cover dividends


