

Ethereum Crypto balances on a neutral daily edge while intraday flows turn risk-on

Market action is caught between mixed higher timeframes and bullish intraday signals, with Ethereum crypto hovering in a key decision area for the next directional leg.
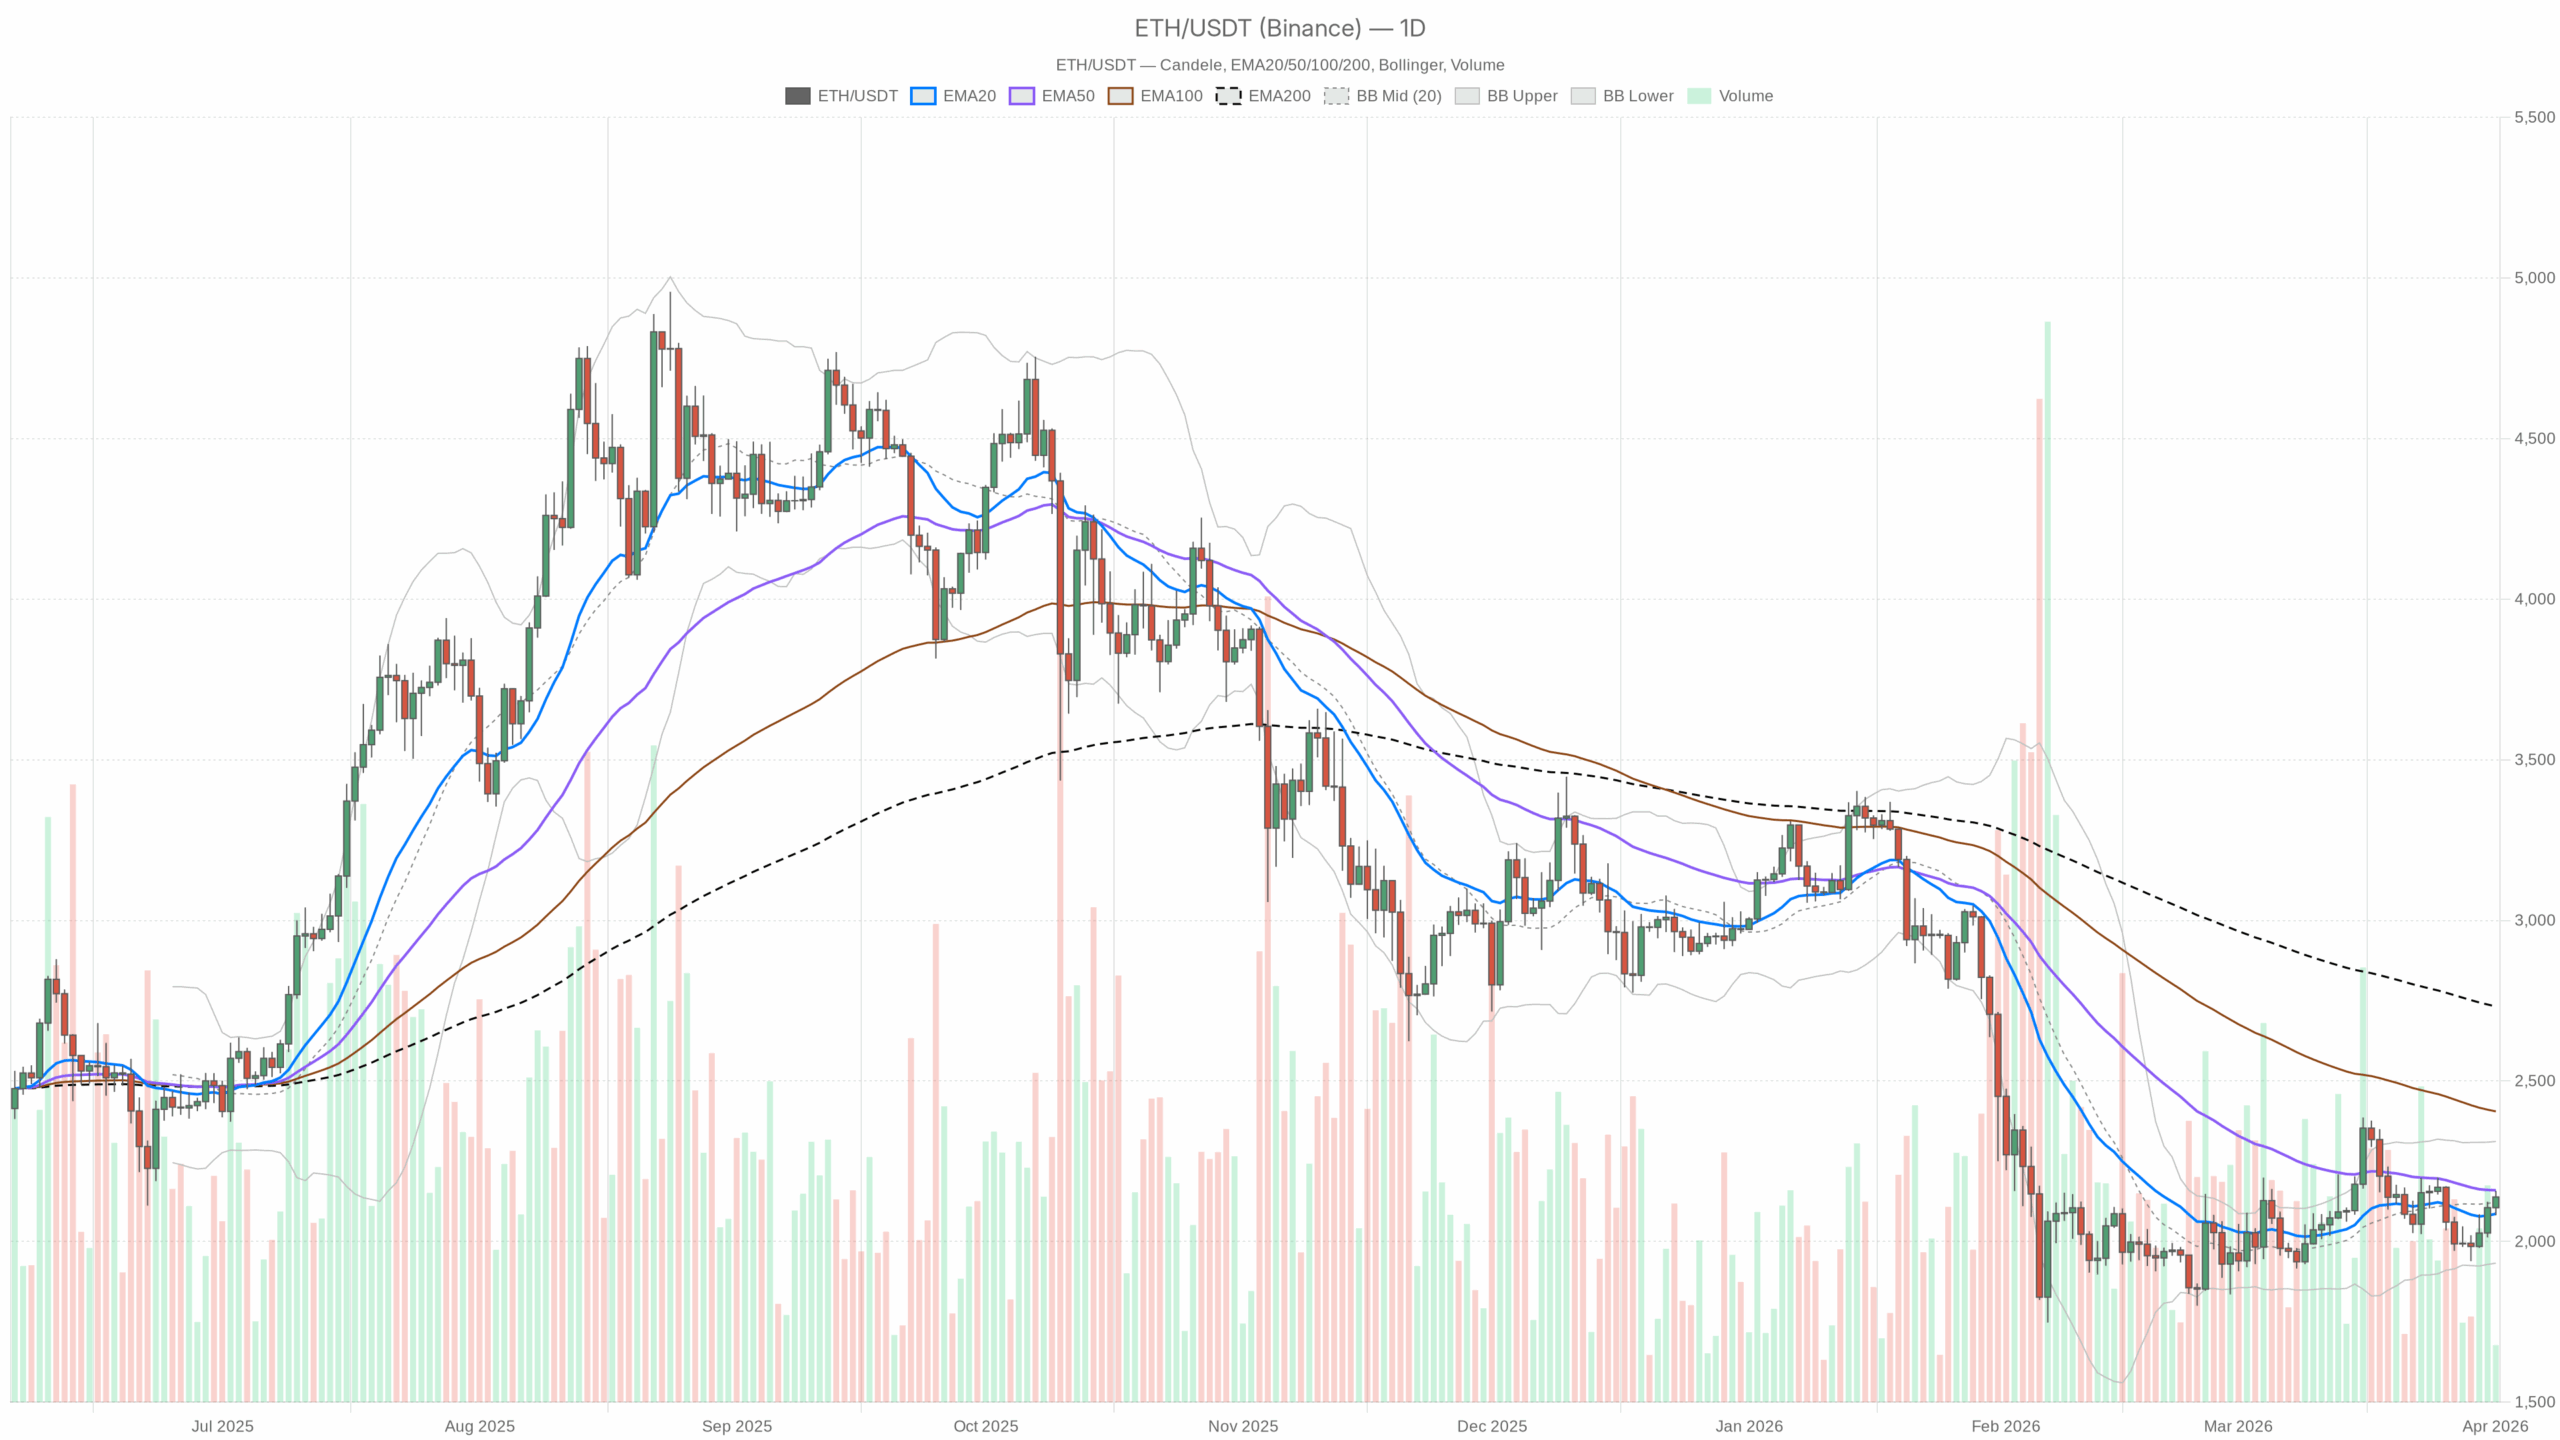 ETH/USDT daily chart with EMA20, EMA50 and volume”
loading=”lazy” />ETH/USDT — daily chart with candlesticks, EMA20/EMA50 and volume.
Main Scenario from the Daily Chart: Neutral with a Slightly Constructive Tilt
The dominant scenario on the daily (D1) is neutral, leaning modestly constructive.
- Price: $2,138.68
- Daily regime label: neutral
- Context: price is above the 20-day EMA but still below the 50-day and well below the 200-day.
That configuration tells us Ethereum is in a short-term repair phase inside a larger, damaged trend structure. Bulls have regained some control in the very near term, but they are still fighting against a longer-term downtrend defined by the 200-day EMA overhead.
Daily Indicators: Structure and Risk Framework
Daily EMAs (Trend Structure)
– 20-day EMA: $2,086.25
– 50-day EMA: $2,159.69
– 200-day EMA: $2,731.97
The spot price at $2,138.68 is trading above the 20-day but still below the 50-day and far below the 200-day. In plain English: short-term momentum has flipped positive, but the medium and long-term trend are still damaged. The 50-day EMA around $2,160 is the first big battlefield for this rebound; the 200-day near $2,730 remains the line that separates a cyclical recovery from a broader bear phase. As long as ETH stays above the 20-day, short-term dip buyers are in control; lose that, and the market slides back into a more fragile posture.
Daily RSI 14 (Momentum Quality)
RSI 14 (D1): 53.57
RSI slightly above 50 shows mild positive momentum but no euphoria. The market is grinding higher rather than squeezing. That often aligns with accumulation or measured short-covering rather than a blow-off move. If RSI can push into the 60–70 zone while price clears the 50-day EMA, you have the start of a more convincing bullish phase; if it rolls back under 50, the bounce likely runs out of steam.
Daily MACD (Trend Confirmation)
– MACD line: -8.45
– Signal line: -5.60
– Histogram: -2.85
The MACD line is still negative and below the signal line, with a slightly negative histogram. That is a lagging confirmation of prior downside and tells us that the larger trend has not fully turned back up yet. In other words, the daily bounce you see in price and RSI has not yet convinced this slower trend gauge. Bulls have work to do; until the MACD crosses positive or at least flips the histogram convincingly above zero, bigger-picture trend traders will remain cautious.
Daily Bollinger Bands (Volatility and Range)
– Middle band (20-day basis): $2,122.18
– Upper band: $2,311.52
– Lower band: $1,932.84
– Close: $2,138.68
ETH is trading just above the mid-band and clearly below the upper band. That places Ethereum crypto in the upper half of its recent volatility range, but not in a breakout. The door is open for a move toward the upper band near $2,310 if buyers stay in control, but there is no sign of a volatility spike yet. If price hugs the mid-band and fails to expand toward the upper band, this bounce risks fading into a sideways chop.
Daily ATR 14 (Risk and Volatility)
ATR 14 (D1): $98.17
A daily ATR near $100 means Ethereum typically swings about $100 per day in this regime. Volatility is elevated enough to punish tight stop placement, but not at crisis levels. For traders, that implies position sizing has to respect roughly 4–5% daily noise; for investors, it simply means this is not a quiet consolidation, and moves can accelerate quickly if sentiment shifts.
Daily Pivot Levels (Reference Map)
– Pivot point (PP): $2,126.25
– First resistance (R1): $2,170.43
– First support (S1): $2,094.51
Price is trading just above the daily pivot at $2,126.25, which keeps ETH on the bullish side of the intraday balance for now. The immediate battle zone is between the pivot and R1 around $2,170; a sustained break above R1 would line up with a push toward the 50-day EMA, while a slip back below the pivot and then S1 near $2,095 would say the market is not ready to challenge higher levels yet.
Intraday Picture: Hourly and 15-Minute Timeframes
1-Hour (H1): Short-Term Regime Clearly Bullish
On the 1-hour chart, ETH is labeled bullish with price at $2,138.77.
H1 EMAs (Short-Term Trend)
– 20-EMA: $2,100.15
– 50-EMA: $2,073.29
– 200-EMA: $2,067.18
Price is trading above all three intraday EMAs, and the stack is 20 > 50 > 200. That is a textbook short-term uptrend. Intraday buyers are in control, and pullbacks toward $2,100–2,075 are likely to attract demand as long as this structure holds.
H1 RSI 14 (Intraday Momentum)
RSI 14 (H1): 64.68
Hourly RSI is pushing into the upper half of the range, leaning toward overbought but not extreme. That reflects a solid bullish push with room left for continuation. If RSI starts grinding above 70 without price making new highs, that would hint at exhaustion; for now, the momentum is still supportive of higher intraday prices.
H1 MACD (Intraday Trend Confirmation)
– MACD line: 19.67
– Signal line: 16.02
– Histogram: 3.66
The hourly MACD is positive, with the line above the signal and a slightly positive histogram. That aligns with the bullish EMA structure and confirms that the short-term trend is currently up and strengthening. It backs the idea that dips on this timeframe are more likely to be bought than sold, unless we see a clear bearish cross and histogram roll-over.
H1 Bollinger Bands (Short-Term Range)
– Middle band: $2,097.03
– Upper band: $2,149.04
– Lower band: $2,045.02
– Close: $2,138.77
ETH is trading near the upper hourly band, reflecting a persistent intraday buy flow. That is bullish in the short run but does raise the risk of a consolidation or minor pullback toward the middle band around $2,097 if buyers pause. If price starts riding the upper band with expanding distance between bands, that is a signal of a stronger breakout-type move.
H1 ATR 14 (Intraday Volatility)
ATR 14 (H1): $19.63
Hourly ATR near $20 points to a typical bar swing of about 1% per hour on this timeframe. That is active but manageable. Day-traders need to give positions enough room to avoid getting shaken out by ordinary noise; scalpers will find plenty of intraday opportunity.
H1 Pivot Levels
– Pivot point (PP): $2,144.76
– First resistance (R1): $2,152.01
– First support (S1): $2,131.51
The hourly price at $2,138.77 is just below the H1 pivot at $2,144.76, but still well above S1 at $2,131.51. Intraday, this looks like a shallow pullback within an uptrend. Reclaiming and holding above the pivot opens up a run at R1 near $2,152; slipping back below S1 would mark the start of a deeper mean reversion within the day’s uptrend.
15-Minute (M15): Execution Context, Still Bullish but Extended
The 15-minute chart is also labeled bullish, with price around $2,138.65.
M15 EMAs
– 20-EMA: $2,126.79
– 50-EMA: $2,109.99
– 200-EMA: $2,071.74
The short-term EMA stack (20 > 50 > 200) reinforces the uptrend. Price is stretched above these averages, which is bullish but also signals short-term extension. On this timeframe, pullbacks into the $2,125–2,115 region would be the natural reload area for intraday bulls.
M15 RSI 14
RSI 14 (M15): 62.83
RSI in the low 60s shows solid but not extreme intraday buying pressure. It is strong enough to justify the trend but not so hot that a reversal is imminent solely on momentum grounds. A move above 70 with price stalling would be the first intraday warning of buyer fatigue.
M15 MACD
– MACD line: 12.32
– Signal line: 10.35
– Histogram: 1.96
The 15-minute MACD is positive, with the line leading the signal and a small positive histogram. That confirms the short-term upward bias, but the modest histogram size hints that momentum is steady, not explosive. If you are timing entries, this says the trend is intact but chasing strength very far from the EMAs carries typical late-entry risk.
M15 Bollinger Bands
– Middle band: $2,121.52
– Upper band: $2,161.18
– Lower band: $2,081.86
– Close: $2,138.65
On the 15-minute, ETH is hovering between the mid- and upper band, signaling a controlled grind higher rather than a spike. That is healthy intraday behavior: buyers are in charge, but volatility is not blowing out. If price keeps leaning into the upper band while bands widen, intraday continuation higher becomes more probable.
M15 ATR 14
ATR 14 (M15): $10.76
An ATR above $10 on a 15-minute candle implies that mini swings are meaningful. Even on execution timeframes, Ethereum crypto is not quiet right now; quick $10–$20 moves in either direction are within normal noise, which matters for tight stops and leverage usage.
M15 Pivot Levels
– Pivot point (PP): $2,139.34
– First resistance (R1): $2,141.18
– First support (S1): $2,136.81
The 15-minute price at $2,138.65 is sitting almost on top of the pivot. Very short term, the market is undecided at this micro-level. A small nudge higher tests R1, while a tiny dip revisits S1. This is where execution precision matters more than directional conviction.
Macro Crypto Backdrop and Sentiment
The broader market context around Ethereum is important to understanding the current setup.
- Total crypto market cap: roughly $2.45 trillion, up about 2.1% in 24h.
- Bitcoin dominance: about 56.3%, with BTC still firmly in control of macro flows.
- Fear & Greed index: 8 – Extreme Fear.
Price action and sentiment are not aligned: capital is returning into crypto, but crowd psychology is still extremely defensive. Historically, that kind of split can fuel sharp mean-reversion rallies when positioning is too cautious. However, extreme fear is often present during protracted downtrends as well, so it is only a tailwind if price action cooperates.
On the DeFi side, Uniswap and other Ethereum-centric DEXs show mixed but generally improving short-term fees after a soft month, pointing to tentative re-engagement in on-chain activity without signaling a full-on risk mania.
Scenario Planning for Ethereum Crypto
Bullish Scenario
In the bullish path, Ethereum crypto continues to respect the 20-day EMA as a rising floor and uses the current intraday strength to push into and through overhead resistance.
Key elements of the bullish case:
- Price holds above the 20-day EMA (~$2,086) and the daily pivot (~$2,126), confirming buyers are defending shallow dips.
- ETH reclaims and sustains trade above the 50-day EMA (~$2,160), with daily closes near or above that level.
- Daily RSI moves into the 60–70 region, reflecting strengthening upside momentum rather than just a dead-cat bounce.
- Daily MACD histogram moves toward zero and flips positive, showing the larger trend is finally aligning with the intraday bullish regime.
- Price expands toward the upper daily Bollinger Band (~$2,310), converting the current mid-band grind into a volatility expansion higher.
If this plays out, the next structural targets sit around:
- $2,310–2,350 (upper band and local resistance zone).
- Beyond that, the 200-day EMA near $2,730 becomes the major inflection point for the entire cycle.
What invalidates the bullish scenario?
The bullish roadmap breaks down if ETH:
- Closes back below the 20-day EMA (~$2,086) with follow-through selling, signaling the bounce failed.
- Sees daily RSI drop back under 50, indicating a loss of upward momentum.
- Breaks and holds below the daily S1 region around $2,095, turning today’s support into resistance.
Bearish Scenario
On the bearish side, the current intraday strength proves to be just a rally within a broader downtrend, and Ethereum crypto resumes its path lower under the heavy 200-day EMA.
Key elements of the bearish case:
- ETH fails to clear and hold above the 50-day EMA (~$2,160), turning that area into a firm ceiling.
- Price slips back below the daily pivot ($2,126) and then below S1 (~$2,095), confirming rejection at resistance.
- Daily MACD stays negative or turns more negative, extending the existing downtrend rather than moderating it.
- RSI rolls back below 50, showing bulls have lost the marginal advantage.
- Price gravitates back toward the middle or lower Bollinger band, initially targeting the mid-zone ($2,120 → $2,000), then potentially the lower band near $1,930 if selling accelerates.
If sellers regain control, the immediate technical targets are:
- $2,050–2,000, a prior congestion and psychological round level.
- Below that, the lower band around $1,930 as a volatility-driven downside magnet.
What invalidates the bearish scenario?
The bearish roadmap weakens significantly if:
- ETH decisively reclaims the 50-day EMA and converts it into support with multiple daily closes above $2,160.
- Daily MACD starts turning up, with histogram climbing toward and above zero, showing the larger trend is shifting.
- Price spends more time near the upper daily Bollinger Band than the mid-band, signaling sustained, not fleeting, buying pressure.
Positioning, Risk, and Uncertainty
Putting it all together for Ethereum crypto, the daily chart is neutral, showing a market in repair mode but not yet in a confirmed uptrend. Both the hourly and 15-minute charts are firmly bullish, which means the path of least resistance intraday is still up, but that short-term strength is pressing into medium-term resistance.
Volatility remains significant, with about $100 of daily range and double-digit intraday noise on lower timeframes. Combined with an extreme fear sentiment reading, that environment tends to reward traders who respect risk limits more than those chasing moves. Short-term players may lean on the intraday bullish structure, but they are doing so under a still-heavy 200-day EMA and in a market where sentiment can flip quickly.
For anyone watching Ethereum closely, the next meaningful information will come from how price behaves around the $2,095–2,170 band. Acceptance above that band pulls ETH toward the upper daily Bollinger and challenges the bearish narrative. Rejection there and a slide back below the 20-day EMA would confirm that this was just another rally inside a larger downtrend. Until that resolves, the bias remains neutral on the daily with a short-term bullish skew.


You May Also Like

Worldex Launches FxFi Infrastructure for Global Currency Access

US Retail Sales rise 0.6% to $738.4 billion in February


