

2026-05-16 Saturday
Bitcoin News
Get the latest Bitcoin insights and market updates.

BTC Loses 100-Day Average as XRP, Ether and Solana Hold Ground
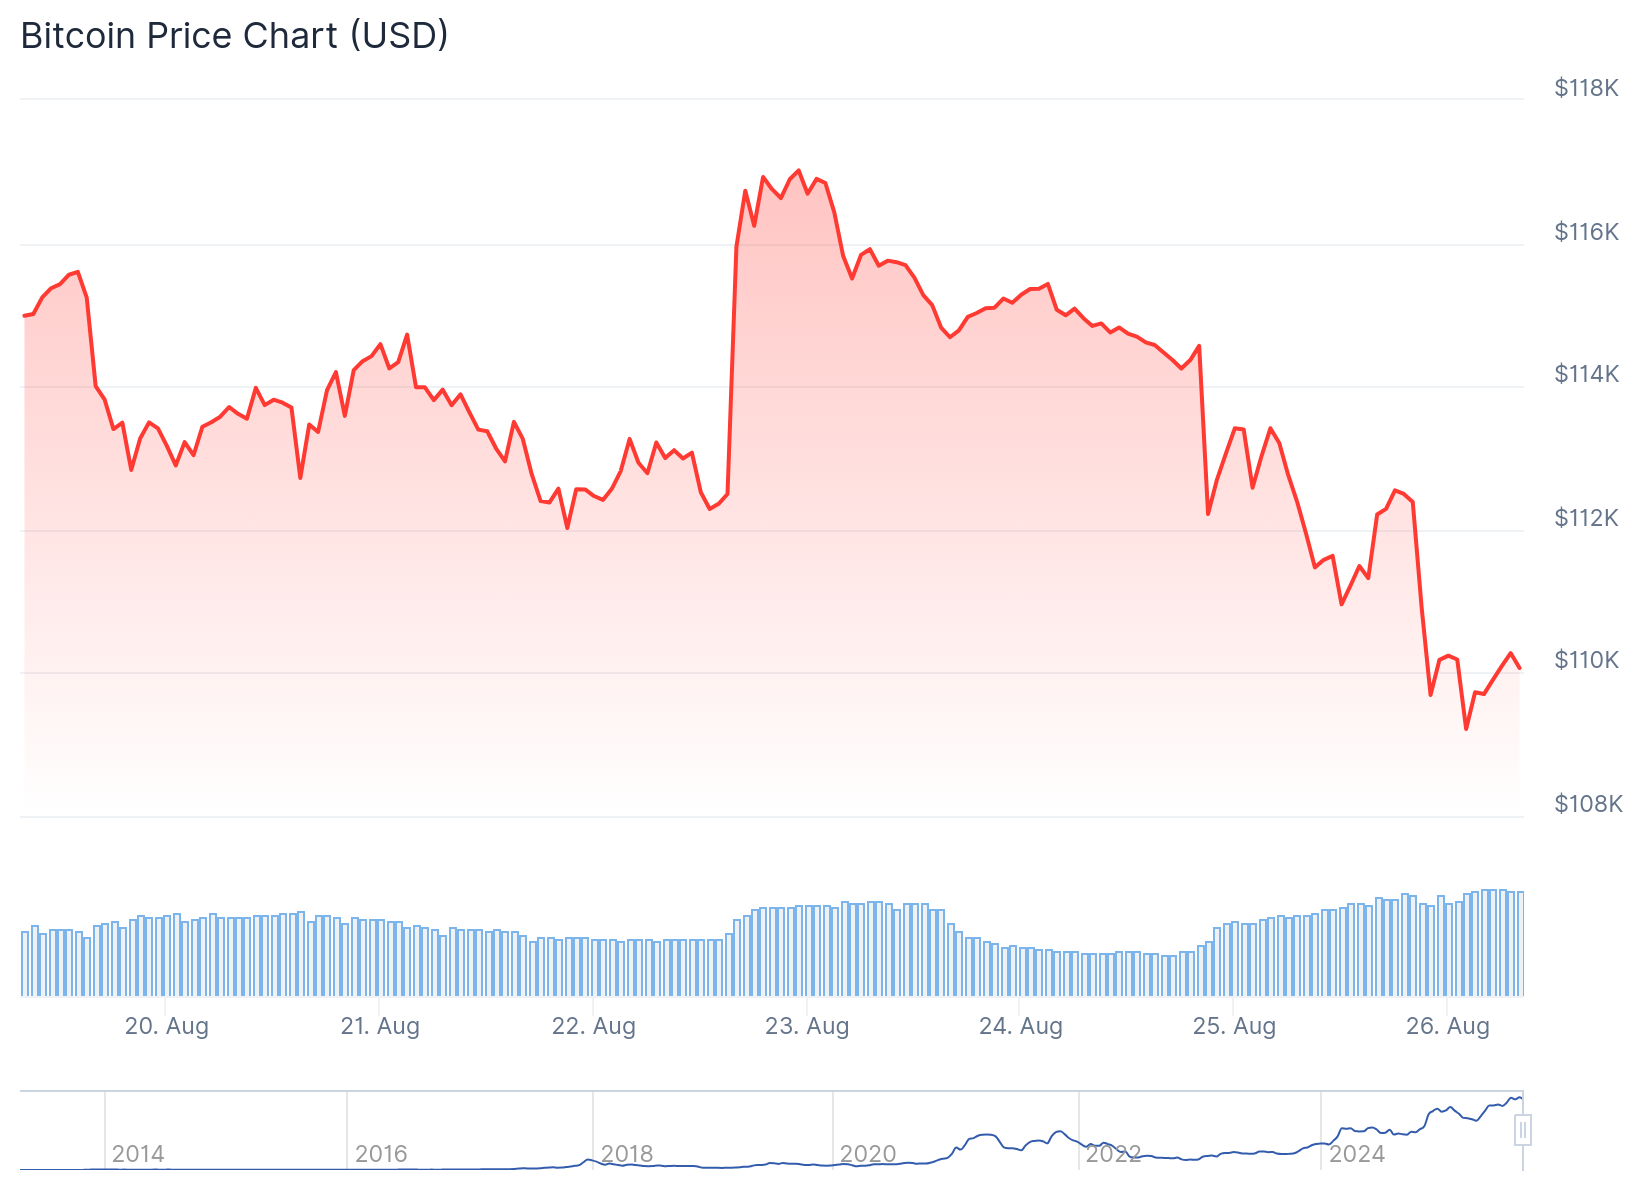
The post BTC Loses 100-Day Average as XRP, Ether and Solana Hold Ground appeared on BitcoinEthereumNews.com. This is a daily analysis by CoinDesk analyst and Chartered Market Technician Omkar Godbole. Bitcoin’s (BTC) technical outlook has deteriorated over the past 24 hours, with prices dropping below a key moving average for the first time since April. This breakdown has left BTC at a disadvantage compared to major tokens such as Ether (ETH), XRP, and Solana SOL$189.77. BTC loses 100-day SMA BTC has dropped over 1% in the past 24 hours, hitting a low of $109,172 at one point. In the process, the cryptocurrency has convincingly dipped below the 100-day simple moving average (SMA), a widely tracked momentum indicator and support/resistance line, for the first time since April 22. Further, prices have crossed below the Ichimoku cloud, indicating a bearish shift in momentum. The dual breakdown has bolstered the bearish technical outlook suggested by the recent violation of the upward-sloping trendline from the April lows and the consecutive negative prints on the longer-duration MACD histogram. Taken together, the recent pattern looks similar to the February breakdown that set the stage for a deeper sell-off to $75K. BTC’s daily chart. (TradingView/CoinDesk) The next key level to watch out for is $105,390, which is the 38.2% Fibonacci retracement of the April-July rally, followed by the 200-day SMA at $100,928. The bulls need to overcome the lower high of $117,416 created on Aug. 22 to negate the bearish technical setup. Resistance: $111,592, $117,416, $120,000 Support: $105,390, $100,928, $100,000. XRP, ETH and SOL hold ground While bitcoin has suffered the dual breakdown, XRP continues to trade above its 100-day SMA. However, prices are “stuck in the Ichimoku cloud,” whichmeans the token is trading within a zone of uncertainty and consolidation where neither bulls nor bears are willing to lead the price action. It suggests indecision and lack of a strong trend. Meanwhile,…
Share
Author: BitcoinEthereumNews2025/08/26 16:15

Hyperliquid price defends $45 as spot volume hits $3.5B all-time high
Hyperliquid holds $45 as BTC and ETH pairs drive record volumes. Will this support level fuel the token’s next breakout?
Share
Author: Crypto.news2025/08/26 15:36

Analysis: BTC's short-term cost line of $108,800 becomes the dividing line between bull and bear markets
PANews reported on August 26th that on-chain analyst Murphy stated that the Short-Term Holder Cost Basis (STH-RP, currently at $108,800) is a sentimental "bull-bear dividing line," reflecting the average turnover cost of short-term holdings. If the BTC price falls below this line, short-term investors will shift from unrealized profits to unrealized losses, potentially causing market sentiment to shift from anxiety to panic and derailing the previous upward trend. Historical data shows that after a breakout, the market recovery period is long, with prices potentially experiencing wide fluctuations or rapid declines, depending on market sentiment and macroeconomic events. The current support range is between $112,000 and $108,000. If broken, there is theoretically still 10%-15% room for decline, but this needs to be judged in light of the actual macroeconomic environment. Analysts recommend that investors develop trading plans in advance and respond flexibly to market fluctuations. They also emphasize that the current macroeconomic cycle is still in a loose phase, the BTC chip structure is healthy, and there are no obvious signs of a bearish turn.
Share
Author: PANews2025/08/26 15:21

Bitcoin Cynic Peter Schiff Warns BTC Could Drop to $75K, Below Strategy’s Avg. Buy
Economist and persistent Bitcoin critic Peter Schiff has predicted that BTC would slip to about $75,000 at a minimum, lower than Saylor-led Strategy’s average cost.
He advocates BTC holders to “sell now and buy back later.” He said in a thread on X that selling now and buying back lower “beats justing riding it all the way down.”
“Given all the hype and corporate buying, this weakness should be cause for concern,” he wrote.
Bitcoin fell 3.12% in the past 24 hours to $109,828, underperforming the broader crypto market. The largest crypto has been down 13% from its high less than two weeks ago.
BTC Could Fall Below MSTR’s Average Cost
Michael Saylor’s Strategy (formerly MicroStrategy), the largest Bitcoin treasury firm, has been holding the token since 2020. The firm bought 3,081 BTC for $356.9 million at an average cost of $115,829 each on Monday.
Strategy now holds a total of 632,457 BTC, worth $69.58 billion per Bitcoin Treasuries data.
According to Peter Schiff’s prediction, Bitcoin would soon witness a plunge to as low as $75,000, a mark that BTC hit in April 2025.
“At a minimum, a decline to about $75K is in play, just below $MSTR’s average cost.”
Bitcoin is Falling Down – Is $75K Plunge Possible?
Though Bitcoin has been tumbling down, Schiff’s prediction seems remote, given other factors driving up the price, gradually.
The recent flash crash is attributed to a massive whale dump that sparked major liquidations. A whale sold 24,000 BTC in a batch of transactions, proving calamitous for Ether that recently hit an all-time high.
Further, Fed Chair Powell’s Jackson Hole speech emphasized labor market risks, which initially fueled a 4% BTC bounce. However, fading momentum reversed gains.
Meanwhile, institutional accumulation continues with the recent Metaplanet’s 103 BTC purchase. Further, U.S. spot Bitcoin ETFs saw massive inflows ($231M) on August 14.
Bitcoin’s trajectory hinges on whether ETF inflows outpace whale selloffs and if macro liquidity aligns with tech innovation
Share
Author: CryptoNews2025/08/26 15:20

Institutional Money Flows Into Solana as Pantera Leads $1.25 Billion SOL Treasury Deal
The post Institutional Money Flows Into Solana as Pantera Leads $1.25 Billion SOL Treasury Deal appeared on BitcoinEthereumNews.com. American venture capital and hedge fund firm, Pantera Capital, is reportedly pursuing a $1.25 billion fundraising effort to convert a Nasdaq-listed company into a dedicated Solana (SOL) treasury vehicle. The move comes as institutional investors continue to increase their crypto exposure. While Bitcoin (BTC) and Ethereum (ETH) remain top choices, Solana is also gaining traction, with multiple high-profile initiatives signaling a growing trend of corporate adoption. Pantera Bets Big on Solana with Nasdaq-Listed Treasury Vehicle Plan According to a report from The Information, Pantera Capital is preparing to raise an initial $500 million from investors. The firm plans to inject the funds into a Nasdaq-listed company, in exchange for new shares for the investors. The company will then use that money to buy Solana, transforming itself into a publicly traded Solana investment vehicle called ‘ Solana Co.’ To scale further, Pantera structured an option to raise another $750 million via warrants. The firm is also committing $100 million. This latest move builds on Pantera’s role as one of the most active backers of digital asset treasury (DAT) firms. Previous disclosures show the firm has deployed over $300 million this year across more than 10 such vehicles. These include Bitcoin-focused Twenty One Capital, Ethereum-committed BitMine and SharpLink, and another Solana-oriented DeFi Development Corp. In fact, earlier this week, Pantera backed Sharps Technology’s effort to raise $400 million to form a Solana treasury. Meanwhile, Pantera is not alone in this push. BeInCrypto reported that Galaxy Digital, Multicoin Capital, and Jump Crypto are reportedly in discussions to raise approximately $1 billion for another Solana treasury vehicle. The surge in Solana treasury initiatives reflects a broader shift in institutional sentiment. CoinGecko data showed that publicly traded companies have committed hundreds of millions into Solana. Five companies hold over 3.7 million SOL ($702 million) in…
Share
Author: BitcoinEthereumNews2025/08/26 15:04

Bitcoin Reacts To Trump Axing Fed Governor Cook: What It Means
The post Bitcoin Reacts To Trump Axing Fed Governor Cook: What It Means appeared on BitcoinEthereumNews.com. Bitcoin Reacts To Trump Axing Fed Governor Cook: What It Means Sign Up for Our Newsletter! For updates and exclusive offers enter your email. Jake Simmons has been a Bitcoin enthusiast since 2016. Ever since he heard about Bitcoin, he has been studying the topic every day and trying to share his knowledge with others. His goal is to contribute to Bitcoin’s financial revolution, which will replace the fiat money system. Besides BTC and crypto, Jake studied Business Informatics at a university. After graduation in 2017, he has been working in the blockchain and crypto sector. You can follow Jake on Twitter at @realJakeSimmons. This website uses cookies. By continuing to use this website you are giving consent to cookies being used. Visit our Privacy Center or Cookie Policy. I Agree Source: https://bitcoinist.com/bitcoin-trump-axing-fed-governor-cook/
Share
Author: BitcoinEthereumNews2025/08/26 15:00

Bitcoin Dives As On-Chain Data Shows Every Cohort Now Selling
On-chain data shows all Bitcoin investor cohorts have pivoted to distribution recently, an indication that a shift in market mood has occurred. Bitcoin Accumulation Trend Score Has Turned Red For All Holders In a new post on X, on-chain analytics firm Glassnode has talked about the latest trend in the Accumulation Trend Score of Bitcoin for the various investor cohorts. The Accumulation Trend Score measures, as its name suggests, the degree of accumulation or distribution that BTC holders are participating in. Related Reading: 215% PENGU Rally Incoming? Analyst Says Token ‘Inches’ From Next Leg Up The indicator uses two factors to calculate the score: the balance changes happening in the wallets of the investors and the size of the wallets involved. This means that larger entities have a higher influence on the indicator. Now, here is a the chart shared by Glassnode that shows the trend in the Bitcoin Accumulation Trend Score across holder groups over the past year: As displayed in the above graph, the Bitcoin Accumulation Trend Score had a value greater than 0.5 for all investor groups back in July, implying a net accumulation behavior across the cohorts. Retail (under 1 BTC), whales (1,000 to 10,000 BTC), and mega whales (above 10,000 BTC) even saw the metric assume a value close to 1 for a while, which corresponds to a near-perfect accumulation trend. Earlier this month, the market buying started to show signs of weakness and now, the behavior has flipped across the holder groups with investors taking to distribution. Fish (10 to 100 BTC) lead the selling with an Accumulation Trend Score near zero. “The uniformity across cohorts highlights broad sell-side pressure emerging in the market,” notes the analytics firm. From the chart, it’s visible that the last time this pattern developed was in January. What followed the sector-wide selloff was a bearish period for Bitcoin. As such, it now remains to be seen whether the recent shift toward distribution would also lead to something similar. Another development that could potentially signal the oncoming of a bearish phase could be BTC’s retest of the Realized Price of the 1 month to 3 months old investors, as Glassnode has explained in another X post. The Realized Price is a metric that calculates the average cost basis of Bitcoin investors. The metric shown in the above chart tracks this value specifically for the holders who purchased their coins between 1 and 3 months ago. Related Reading: When Will Bitcoin Bottom Out? This Could Be The Signal To Watch At present, the indicator is sitting at $110,800, which is around where BTC has been trading following its decline. “Historically, failure to hold above this level has often led to multi-month market weakness and potential deeper corrections,” says the analytics firm. BTC Price At the time of writing, Bitcoin is floating around $109,900, down more than 5% over the last seven days. Featured image from Dall-E, Glassnode.com, chart from TradingView.com
Share
Author: NewsBTC2025/08/26 15:00
Bitcoin (BTC) Price Prediction: $2.7 Billion Whale Dump Triggers Massive Leverage Flush
TLDR Bitcoin crashed below $109,000 after a whale sold 24,000 BTC worth $2.7 billion All Bitcoin wallet cohorts have shifted into distribution mode, creating sell-side pressure The $105,000 level has emerged as the key support zone before potential deeper corrections Over 205,000 traders were liquidated in a $930 million liquidation event Bitcoin’s seasonal weakness period [...] The post Bitcoin (BTC) Price Prediction: $2.7 Billion Whale Dump Triggers Massive Leverage Flush appeared first on CoinCentral.
Share
Author: Coincentral2025/08/26 14:59

Robinhood, Strategy shares dip as they miss out on S&P 500 inclusion
Robinhood and Strategy both saw their stock prices sink as they were looked over for inclusion on the S&P 500, which went to Interactive Brokers Group. Shares in trading platform Robinhood Markets and Bitcoin treasury firm Strategy fell in after-hours trading on Monday after missing out on being included in the S&P 500, amid a broader market dip. S&P Dow Jones Indices said late Monday that brokerage Interactive Brokers Group would join the index tracking the 500 largest US companies at market open on Thursday and replace the pharmacy chain Walgreens Boots Alliance.Wall Street has long been expecting Robinhood to join the S&P 500, and MicroStrategy, trading as Strategy, had recently become eligible for inclusion as its market cap has been boosted by the rising value of its Bitcoin (BTC) holdings.Read more
Share
Author: Coinstats2025/08/26 14:12

Altseason odds – What next after latest round of crypto liquidations?
The post Altseason odds – What next after latest round of crypto liquidations? appeared on BitcoinEthereumNews.com. Key Takeaways Altcoin Open Interest hit $61.7 billion as the Altcoin Season Index hit 61 – Its first test since early 2025. And yet, fading rotational flows raised doubts about whether this breakout signals a lasting altseason or not. In less than 72 hours, the crypto market shed nearly $20 billion, with Bitcoin [BTC] alone losing roughly $10 billion and showing that this cycle is still very much “BTC-led.” Backing this, Bitcoin dominance [BTC.D] slipped to multi-month lows at 57%, while TOTAL2 (ex-BTC cap) fell in tandem. All in all, rotational flows remained flat, reinforcing a risk-off market. Altcoin OI surges despite muted flows Against that backdrop, Altcoin Futures Open Interest (OI) blew up +$9.2 billion on Friday, 22 August, taking the total alt OI (red line) to a fresh all-time high of $61.7 billion. This pointed to rising leverage in alts, despite short-term chop. Source: Glassnode Typically, spikes in OI tend to track Bitcoin’s price action. However, top altcoin OI (beige bars) has steadily climbed from $20 billion in March to $60 billion by late August, adding nearly $40 billion, outperforming BTC’s $30 billion OI growth over the same period. Put simply, the altcoin market might be overheated. Traders might be front-running an altseason, but with rotational flows muted, could this feed a volatility loop instead? Altcoin index breaks out, but history urges caution High leverage across alts amplified the pullback. Supporting this, top altcoin Ethereum [ETH] saw a nearly 4% drop in OI over the past 24 hours, aligning with its 3% price decline. All while Bitcoin contained its drop to 2.68%. Having said that, top altcoins have endured deeper hits, initially triggered by BTC’s correction, but magnified as leverage got flushed out. This dragged the Altcoin Season Index down to 56 from 61 just a day prior.…
Share
Author: BitcoinEthereumNews2025/08/26 14:09


