

Cardano Faces Decline as Bulls Eye $0.75 Resistance for Recovery
- Cardano (ADA) falls 4.31% in 24 hours, with a significant drop in trading volume, signaling stagnation.
- The ongoing decline over the past week suggests challenges ahead, with bears likely to push the price lower.
- Analysts see potential recovery for ADA, but resistance levels at $0.72–$0.75 are key to a possible rally.
Cardano (ADA) is currently trading at $0.6424, showing a 4.31% drop in the last day. The trading volume has also reduced by 15.5% and is currently standing at $910.69 million. The fall in volume signifies that the market is stagnant.
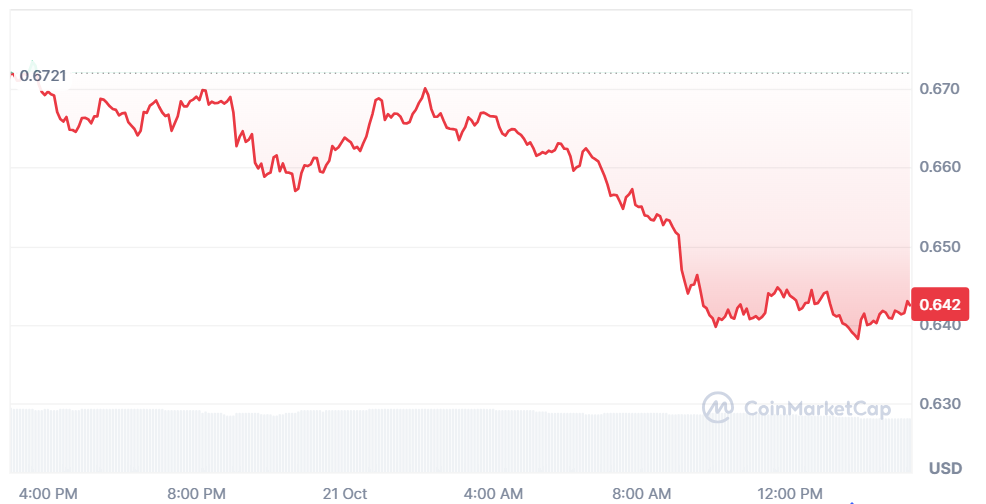
Source: CoinMarketCap
Over the past week, the ADA coin price has decreased by 4.93%. Such a long-term declining pattern shows that Cardano will have a hard time, and the price will decline both in the short and medium term.
Cardano Eyes Recovery as Resistance Levels Approach
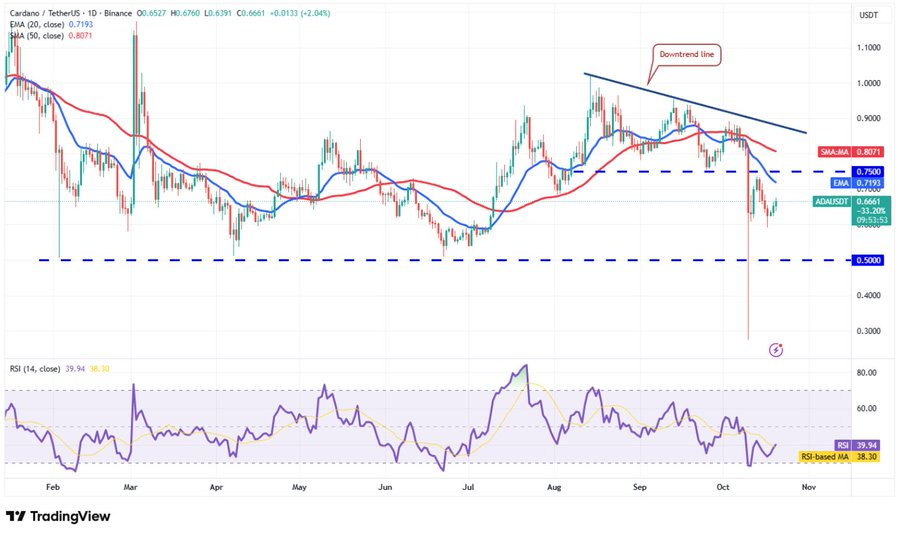
Crypto Zayn, a crypto analyst, highlighted that ADA provides signs of potential recovery. He notes that the levels of resistance that the bulls are pursuing are in the ranges of $0.72 and $0.75. The next important level that should be observed is the 50-day Simple Moving Average (SMA) at $0.80. Breaking these resistance levels, ADA can shift to rally toward $1.02, which will give investors hope.
Source: X
However, there are risks. ADA will be lost even further in the event that it does not penetrate the resistance zone. Zayn warns that in case the price falls to less than $0.60, bears would push the price down to $0.50. This would lead to increased selling pressure and worsen the poor market sentiment.
Also Read: Bitcoin Stabilizes Near $111,000 as On-Chain Data Shows Cooling Volatility
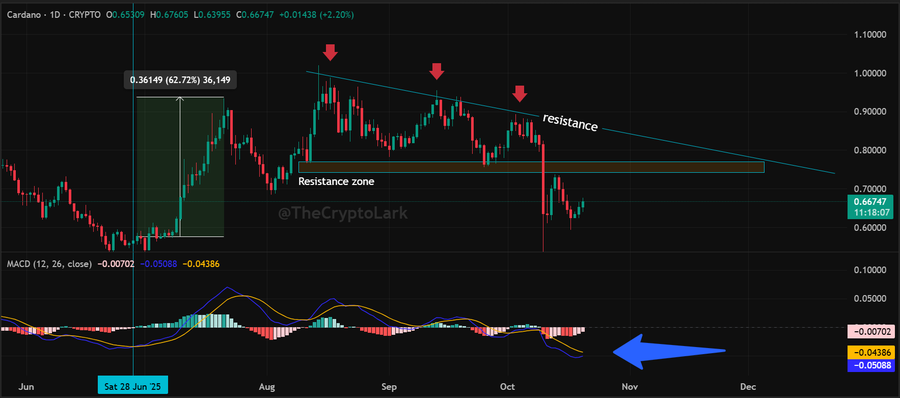
Furthermore, another analyst, Lark Davis, mentioned that ADA was going to be printing a daily MACD golden cross below zero. The trend has been long-standing with sharp price increases, the latest being ADA, where the value has increased more than 60%.
Nonetheless, ADA needs to overcome the resistance zone between $0.74 and $0.77 to reinforce the rally. This is despite a lower resistance line that started in August, which remains a big challenge.
Source: X
Open Interest Decline Reflects Weak Market Sentiment
According to CoinGlass data, the trading volume dropped by 16.44% to $1.31 billion. The Open Interest has decreased by 0.10%, and it is currently at $616.14 million. The ADA OI-Weighted Funding rate is -0.0036%. This indicates that investors in the market are not very confident.
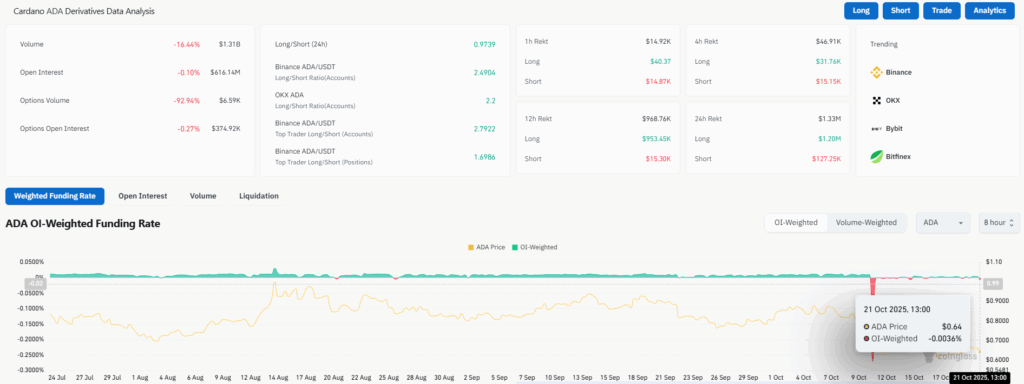
Source: CoinGlass
Nonetheless, Cardano is moving downwards, yet analysts are not ruling out a recovery. The future of ADA is in its ability to conquer its critical resistance points. As long as ADA will be able to break those barriers, it may be reaffirmed and regain momentum. The market remains volatile, and price movement in ADA will play a decisive role in determining its future direction.
Also Read: Avalanche (AVAX) Eyes Breakout as Falling Wedge Signals Possible Reversal
You May Also Like

the “ambient gambling” shift coming to brokerage accounts

Markets await Fed’s first 2025 cut, experts bet “this bull market is not even close to over”
