2026-05-20 Wednesday
Ethereum News
Follow the latest Ethereum trends and ecosystem updates.

ASTEROID Profit Turns $575 Into $1.17M
A trader turned $575 into $1.17M in just 5 days after selling 2.79B ASTEROID for 503 ETH. Wild 2,000x+ gain. #Crypto #ETH #ASTEROID
Share
Author: CoinoMedia2026/04/22 14:00
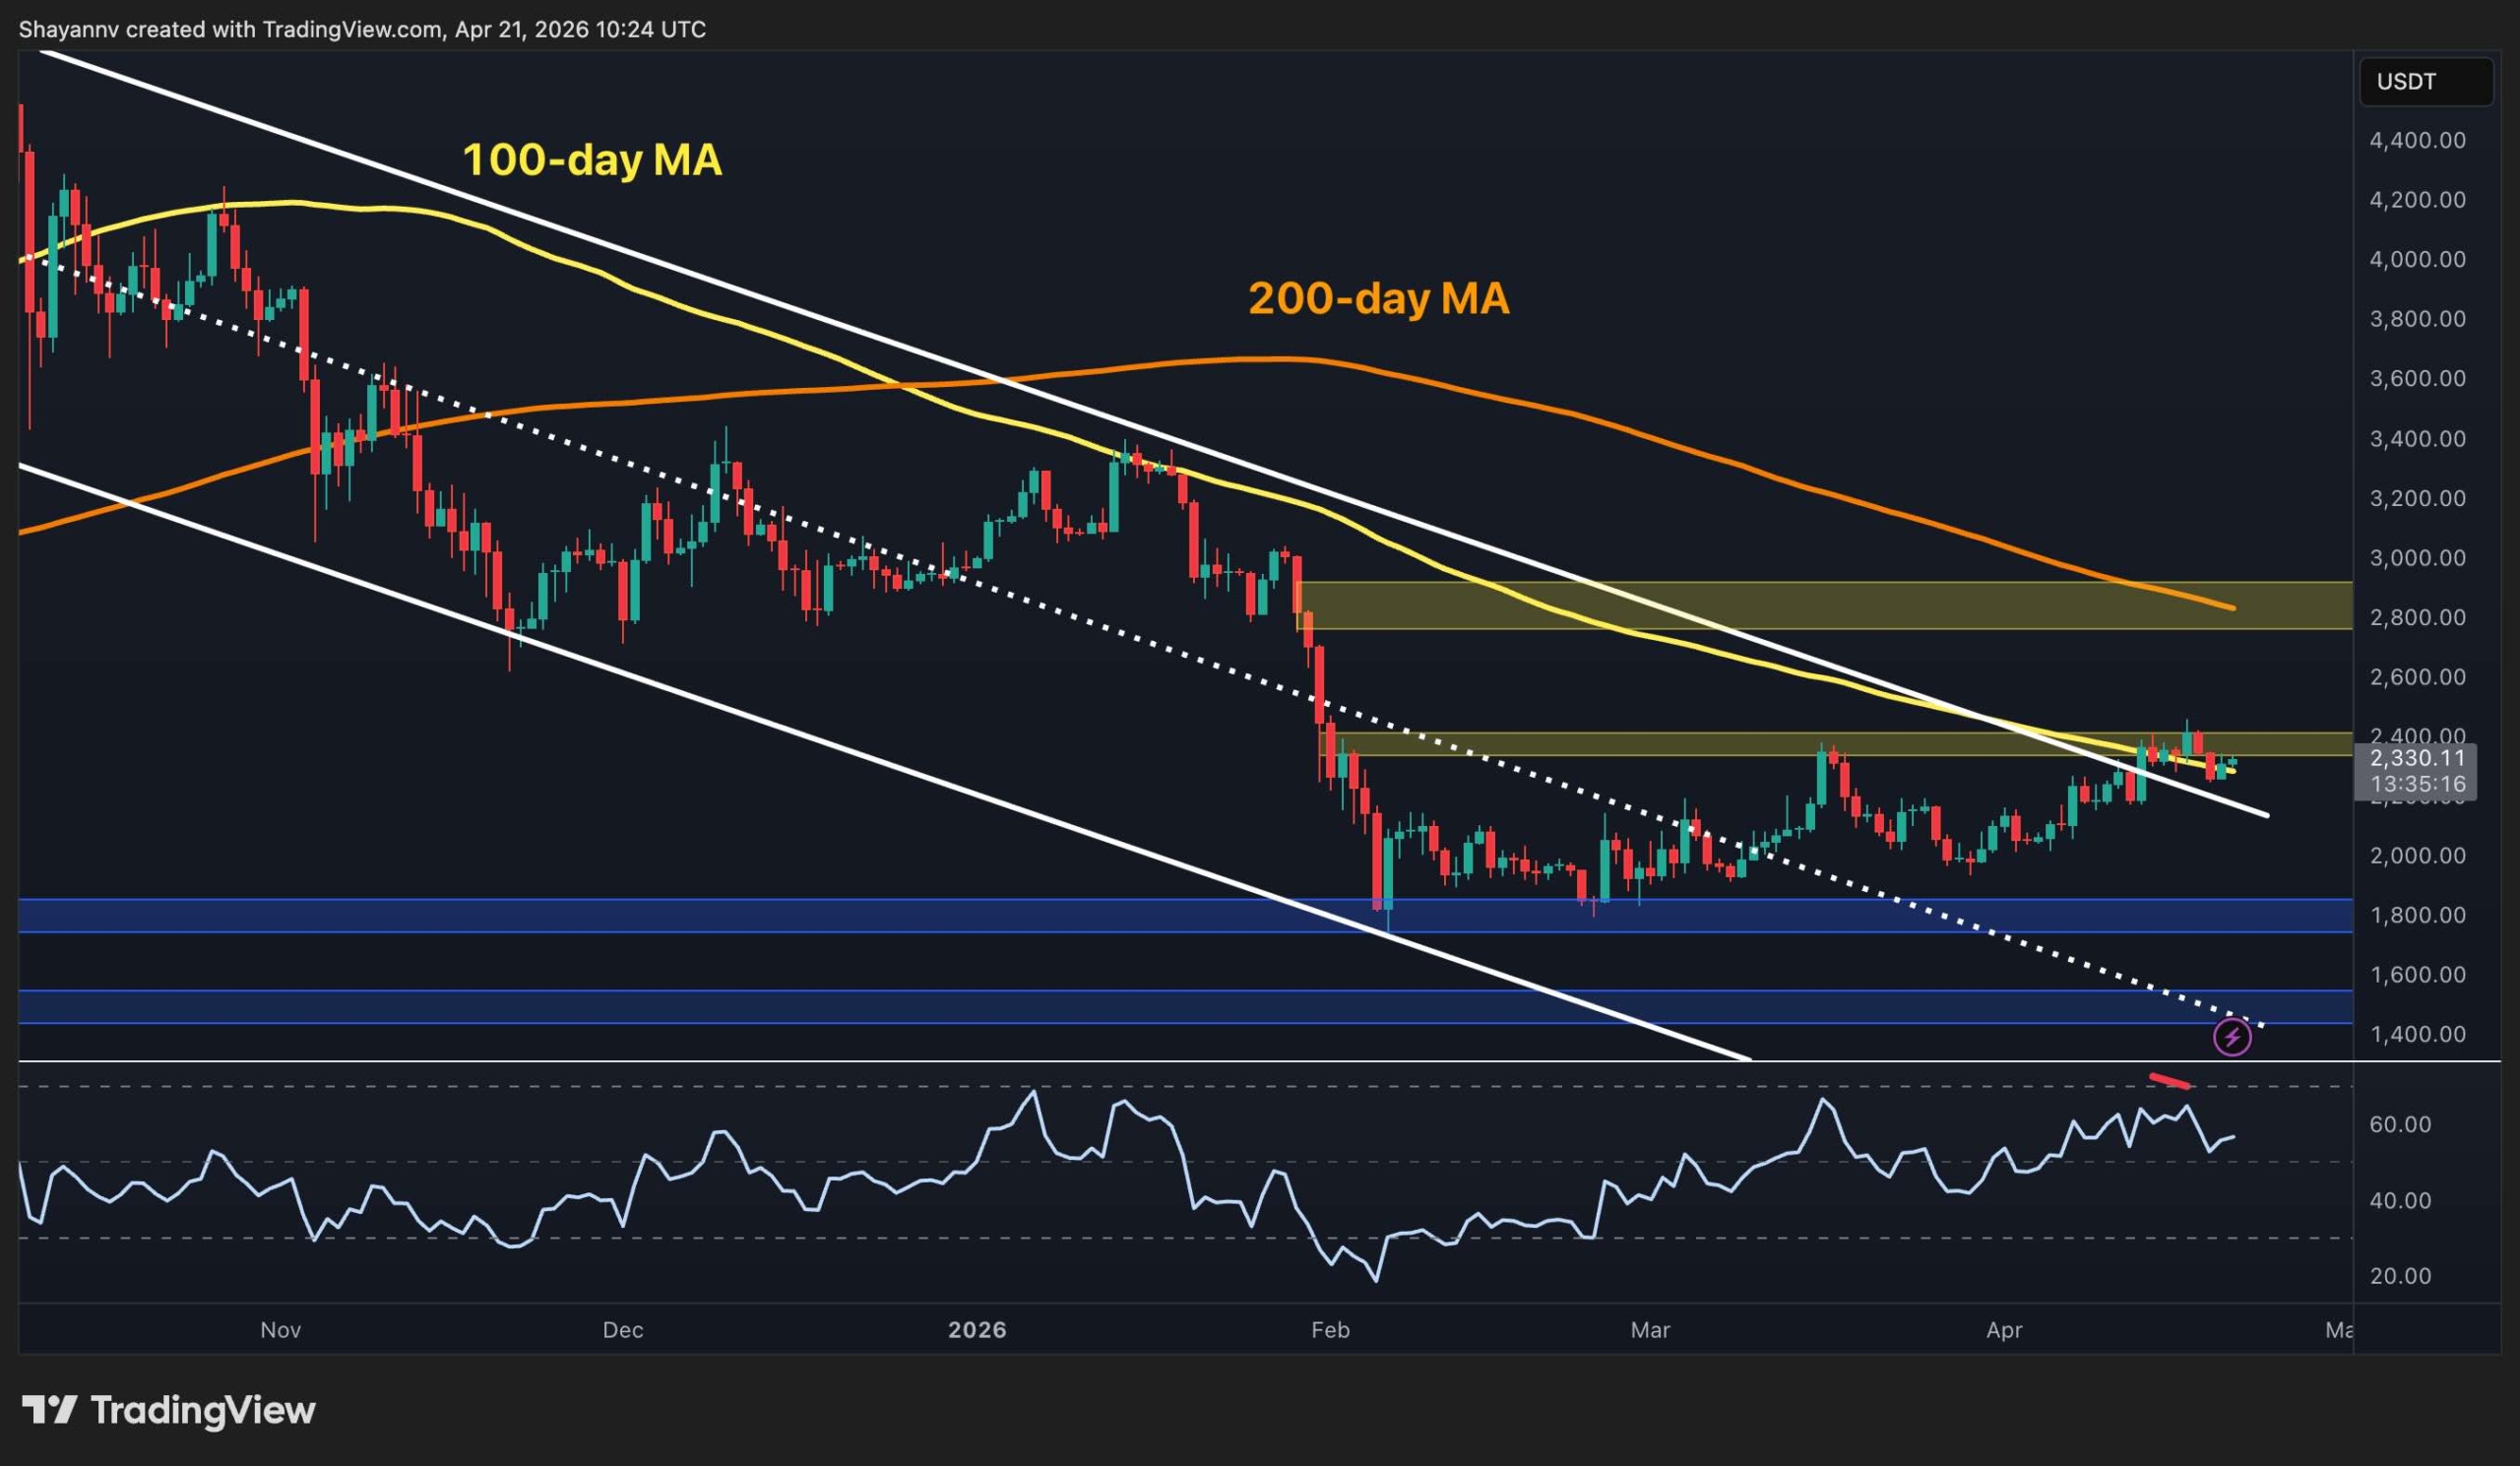
Ethereum Price Prediction: $2,500 Seems Imminent as ETH Gains 14% Monthly
Ethereum is trading around $ 2,350 and is at a pivotal moment that will likely define its trajectory in the weeks ahead. The asset has spent the better part of
Share
Author: CryptoPotato2026/04/22 12:31

Ethereum Price Struggles To Gain Pace, Recovery Remains Fragile
Ethereum price started a recovery wave above the $2,300 zone. ETH is now consolidating and might struggle to continue higher above the $2,385 resistance. Ethereum
Share
Author: NewsBTC2026/04/22 11:08

Venus Protocol Hacker’s Shocking $5.3M Tornado Cash Laundering Move Exposes DeFi Vulnerabilities
BitcoinWorld Venus Protocol Hacker’s Shocking $5.3M Tornado Cash Laundering Move Exposes DeFi Vulnerabilities In a significant development for decentralized finance
Share
Author: bitcoinworld2026/04/22 10:25

Ethereum Price Prediction: Revolutionary Report Suggests $250K ETH by Capturing Gold and Bitcoin’s Monetary Premium
BitcoinWorld Ethereum Price Prediction: Revolutionary Report Suggests $250K ETH by Capturing Gold and Bitcoin’s Monetary Premium December 15, 2025 — A groundbreaking
Share
Author: bitcoinworld2026/04/22 10:10

Solana outpaces Ethereum with 25.3B transactions – Will SOL/ETH finally react?
The post Solana outpaces Ethereum with 25.3B transactions – Will SOL/ETH finally react? appeared on BitcoinEthereumNews.com. Developer activity and on-chain activity
Share
Author: BitcoinEthereumNews2026/04/22 10:08
Ethereum Price News: ETH Flashes a Bullish Setup No Holder Should Miss While Pepeto Nears Its Binance Listing
Ethereum price news on April 21 points to a setup that defines entries for the full cycle. ETH sits at $2,309 after seven straight sessions of positive spot ether
Share
Author: Blockonomi2026/04/22 09:10

SPX6900 up 11% amid ‘ETH meme season’ buzz: Can SPX break $0.38?
The post SPX6900 up 11% amid ‘ETH meme season’ buzz: Can SPX break $0.38? appeared on BitcoinEthereumNews.com. SPX6900 [SPX] was among the best-performing memecoins
Share
Author: BitcoinEthereumNews2026/04/22 09:05