IREN Ltd. stock price continued its strong surge this month after the company inked a major data center partnership with Microsoft.  IREN, a top company in the Bitcoin (BTC) mining and data center industry, jumped to a record high of…IREN Ltd. stock price continued its strong surge this month after the company inked a major data center partnership with Microsoft.  IREN, a top company in the Bitcoin (BTC) mining and data center industry, jumped to a record high of…

IREN stock jumps on heels of $9.7b Microsoft deal, analyst raises price targets

2025/11/05 02:10
3 min read

IREN Ltd. stock price continued its strong surge this month after the company inked a major data center partnership with Microsoft. 

Summary
  • IREN share price jumped after inking a $9.7 billion deal with Microsoft.
  • Analysts anticipate similar deals as it scales its data centers.
  • Technical analysis suggests that the stock will retreat after earnings.

IREN, a top company in the Bitcoin (BTC) mining and data center industry, jumped to a record high of $75.3. It has soared by over 1,200% from its lowest level this year, bringing its market capitalization to over $19 billion. 

IREN stock has jumped after the company reached a $9.7 billion deal with Microsoft. This five-year deal will start implementation in 2026 and will include a 20% prepayment. It is estimated to have an EBITDA margin of 85%.

This is a significant validation for a company that pivoted to the AI colocation industry recently. Its most recent financial results showed that its AI collocation business generated just $7 million in the fourth quarter. 

By inking a deal with Microsoft, the hope is that the business will attract potential customers like Oracle, Meta Platforms, OpenAI, Amazon, and Anthropic. 

OpenAI has already made a similar deal with CoreWeave, while Meta Platforms reached a similar one with Nebius. 

Wall Street analysts believe that IREN’s business will continue to perform well in the coming years. Yahoo Finance‘s data shows that the average estimate for its revenue, to be released on Thursday, will be $241 million, a 344% annual increase.

It will then make $257 million in its second quarter and $1.2 billion in the current financial year. These are huge numbers for a company that made $512 million in the last financial year.

Most importantly, unlike CoreWeave, its business is already profitable, with annual earnings per share expected to be $1.6, up from 35 cents.

Analysts are optimistic that IREN’s stock price has more upside. In a note this week, Darren Aftahi, an analyst from Roth MKM, boosted his estimate from $82 to $94, representing a 55% upside from the current level.

Gautam Chugani, a Bernstein analyst, estimates that the stock will rise to $75, up by 24% from the current level.

IREN stock price technical analysis 

IREN stock

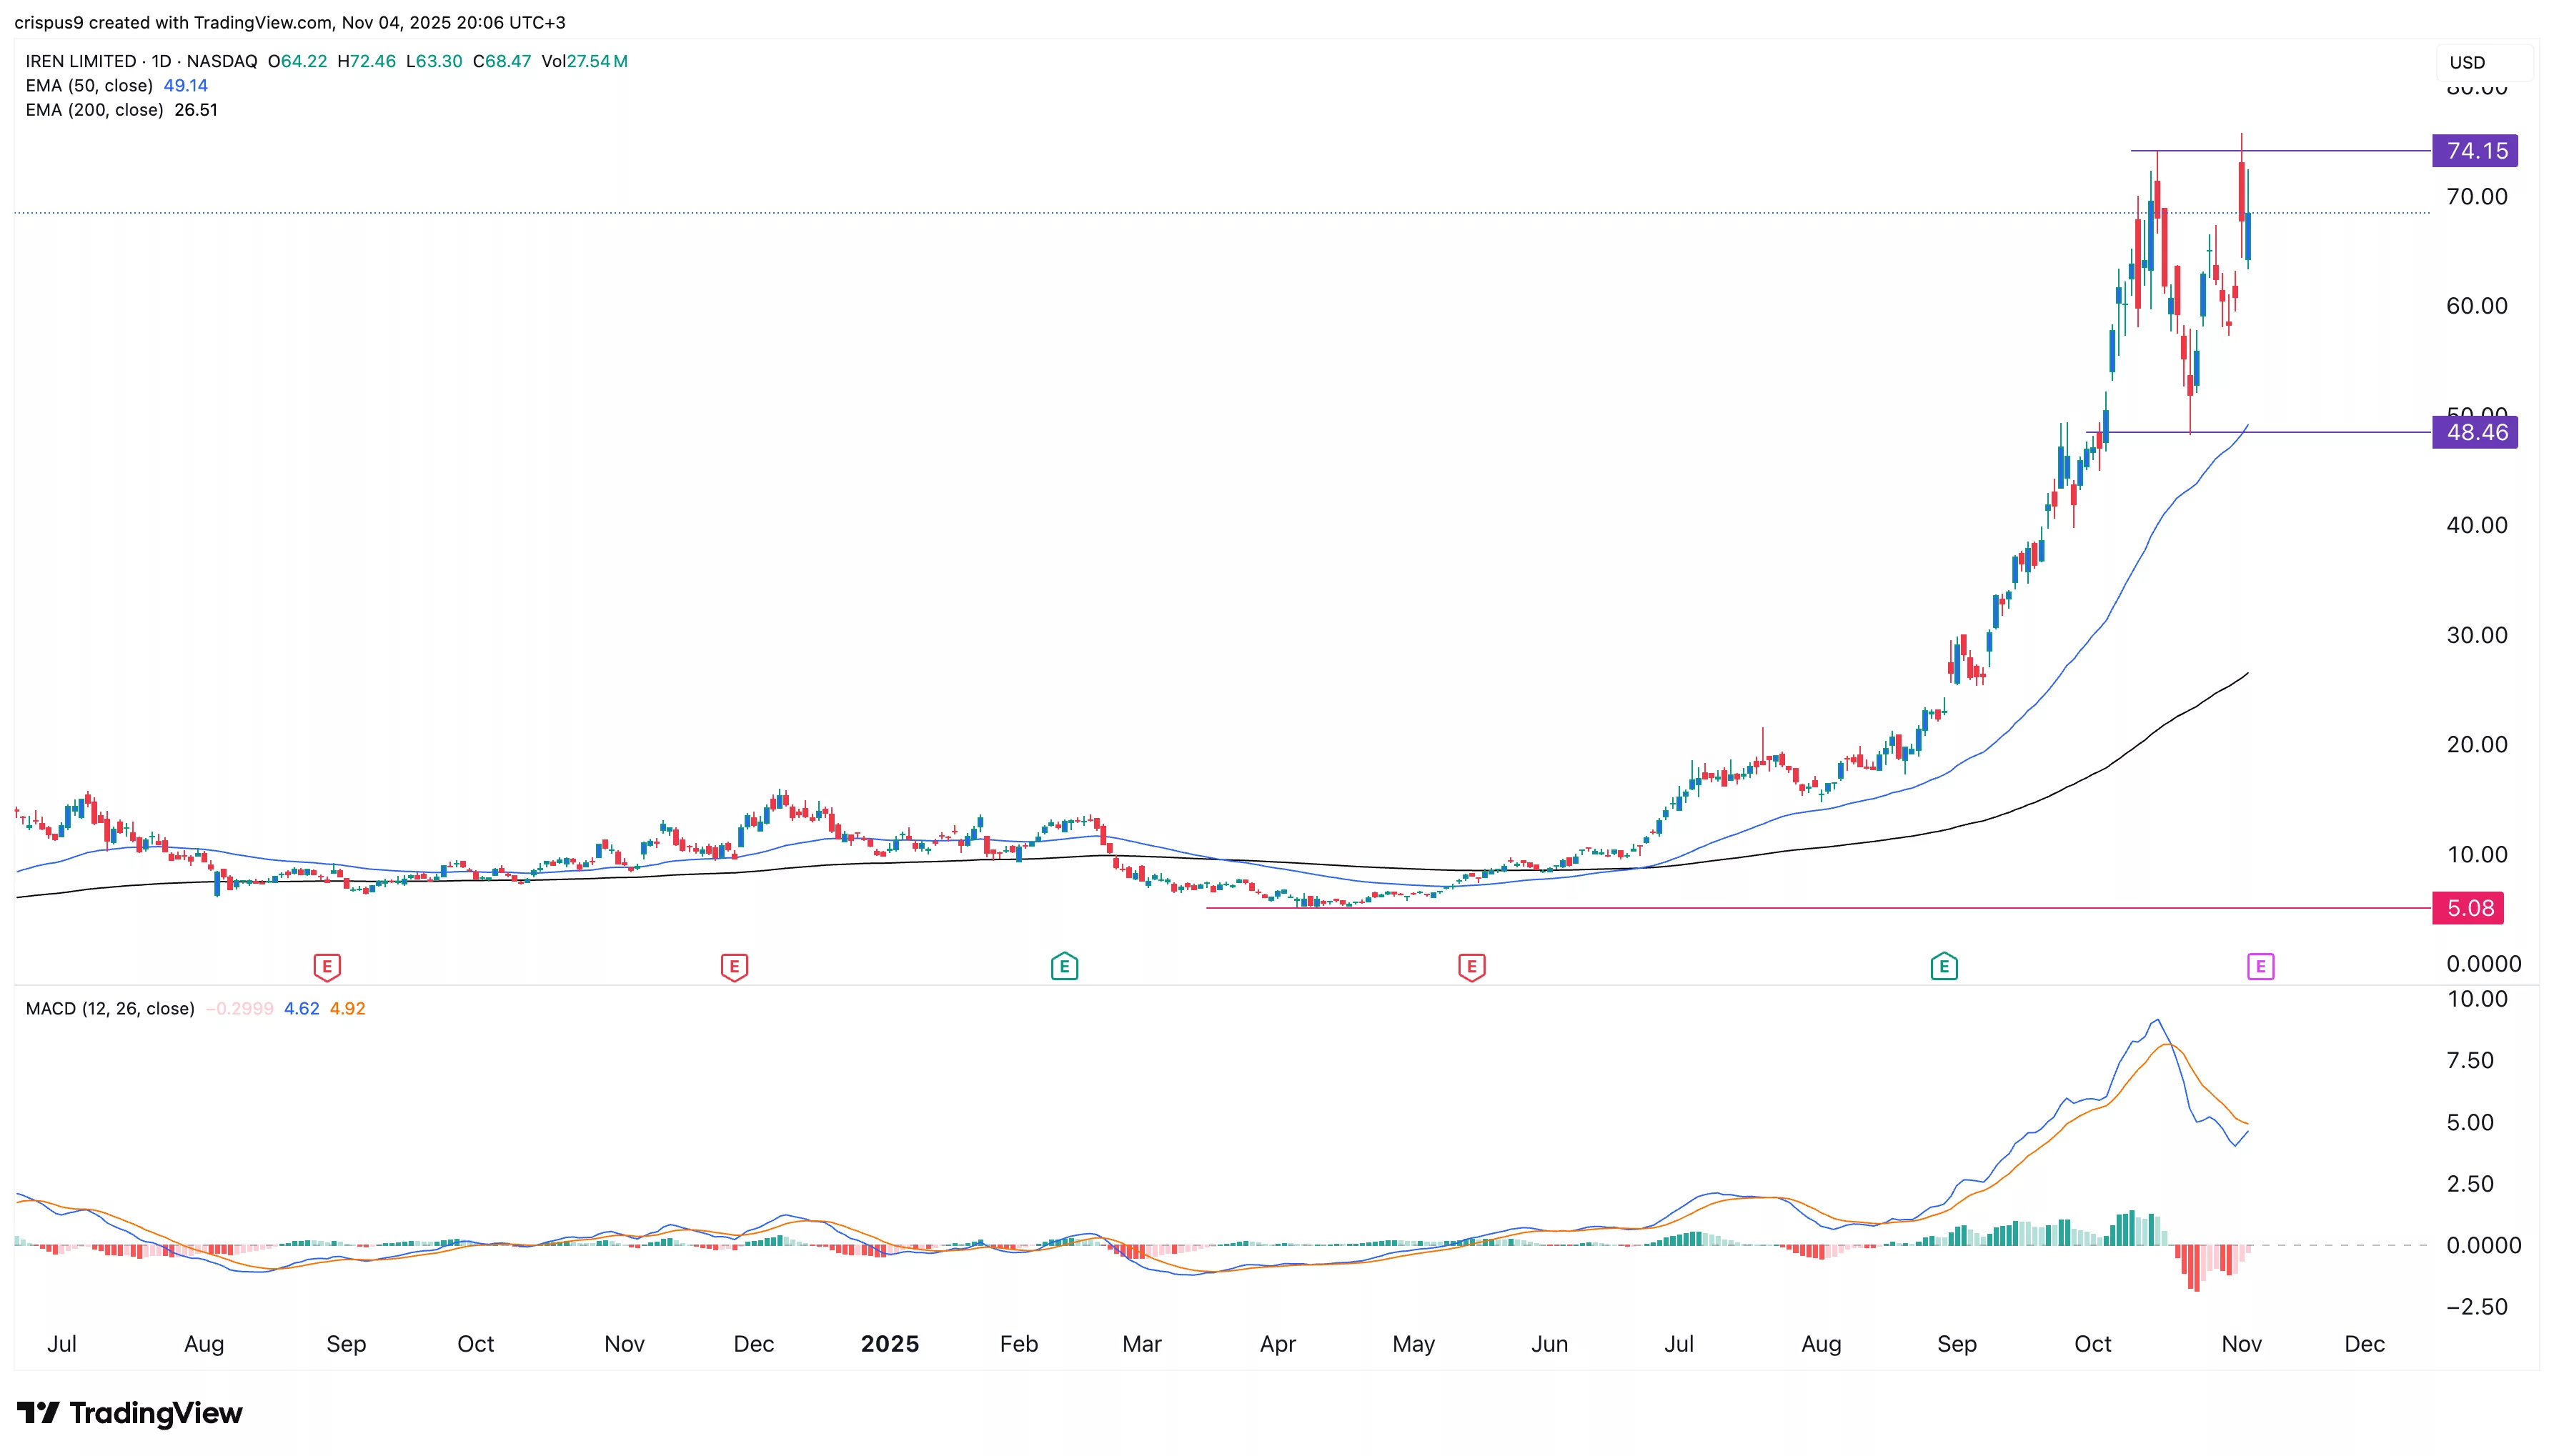
The daily timeframe chart shows that the IREN share price has been in a strong uptrend this year, moving from a low of $5 in April to a high of $75 this week.

As a result, the stock has remained above all moving averages, a sign that bulls are in control.

However, the risk is that the stock has formed a double-top pattern at $74 and a neckline at $48. It has also formed a bearish divergence pattern as the MACD indicator has pointed downwards.

Therefore, the stock will likely have a strong bearish breakdown as investors sell the news. This retreat will likely happen when it publishes its results later this week. 

Market Opportunity
Major Logo
Major Price(MAJOR)
$0.06617
$0.06617$0.06617
-2.20%
USD
Major (MAJOR) Live Price Chart
Disclaimer: The articles reposted on this site are sourced from public platforms and are provided for informational purposes only. They do not necessarily reflect the views of MEXC. All rights remain with the original authors. If you believe any content infringes on third-party rights, please contact [email protected] for removal. MEXC makes no guarantees regarding the accuracy, completeness, or timeliness of the content and is not responsible for any actions taken based on the information provided. The content does not constitute financial, legal, or other professional advice, nor should it be considered a recommendation or endorsement by MEXC.
Tags:

You May Also Like

Vitalik Buterin Divests Ethereum, Triggers Market Debate

Vitalik Buterin Divests Ethereum, Triggers Market Debate

The post Vitalik Buterin Divests Ethereum, Triggers Market Debate appeared on BitcoinEthereumNews.com. Vitalik Buterin, Ethereum’s co-founder, has once more taken
Share
BitcoinEthereumNews2026/02/24 05:32
Leasing Commences at The NRP Group’s New 300-Unit Mixed-Income Community, Sutton Flats, in Sherman, Texas

Leasing Commences at The NRP Group’s New 300-Unit Mixed-Income Community, Sutton Flats, in Sherman, Texas

Sutton Flats delivers thoughtfully designed homes and premium amenities to residents near the I-75 and major employment hubs DALLAS–(BUSINESS WIRE)–The NRP Group
Share
AI Journal2026/02/24 05:00
SUI Price Eyes Breakout, Targets $11 Says Analyst

SUI Price Eyes Breakout, Targets $11 Says Analyst

The post SUI Price Eyes Breakout, Targets $11 Says Analyst appeared on BitcoinEthereumNews.com. SUI price shows a technical setup for a macro breakout with analyst Dan Gambardello targeting $10-$11 levels. Recent partnership with Google’s Agentic Payments Protocol adds fundamental support to the technical analysis as SUI moves closer to potential breakout levels. SUI Price Analysis Points to $10-$11 Breakout Target Dan Gambardello has identified a clear ascending triangle formation on SUI price daily chart with upside targets around $10.79. The analyst simplified this target range to $10-$11 for practical trading purposes. The pattern shows sustained higher lows meeting resistance at current levels before a potential breakout. VanEck maintains more aggressive SUI crypto targets ranging from $13-$25 according to Gambardello’s research. SUI Price Analysis | Source: Dan Gambardello, X The $10 level is a more conservative higher high area for the current cycle. Midterm targets point to $7.50 in the 1.618 Fibonacci extension zone before longer-term objectives. The monthly RSI shows extreme compression that Gambardello describes as “screaming for a macro breakout to the upside.” This momentum oscillator behavior typically precedes major price movements in the crypto market. SUI crypto risk model currently sits at 51 and matches pre-bull market levels seen in coins like Ethereum. Gambardello compared this to Ethereum’s December 2020 reading of 51 before its major breakout. The March 2017 Ethereum reading of 53 preceded that cycle’s parabolic move. The analyst also noted that SUI price trades near the same levels from almost a year ago in November 2024. Bollinger Bands Signal Historic Compression CryptoBullet has identified the tightest Bollinger Bands in SUI’s entire trading history on the weekly chart. The BBW indicator compression reached levels that were historically followed by major price movements. This setup mirrors conditions before SUI’s previous major rallies. Historical data shows SUI price delivered +253% gains between December 2023 and March 2024 following similar compression. SUI…
Share
BitcoinEthereumNews2025/09/18 11:32