TLDR Shiba Inu’s price stagnates near key support as market shows no significant movement or volatility. On-chain data reveals minimal activity, with Netflow and Exchange Reserve showing little change. Shiba Inu remains trapped in low liquidity, awaiting a potential breakout or macro catalyst. RSI remains flat, indicating no substantial buying or selling pressure in the [...] The post Shiba Inu Faces Paralysis: Will Market Activity Ever Return? appeared first on CoinCentral.TLDR Shiba Inu’s price stagnates near key support as market shows no significant movement or volatility. On-chain data reveals minimal activity, with Netflow and Exchange Reserve showing little change. Shiba Inu remains trapped in low liquidity, awaiting a potential breakout or macro catalyst. RSI remains flat, indicating no substantial buying or selling pressure in the [...] The post Shiba Inu Faces Paralysis: Will Market Activity Ever Return? appeared first on CoinCentral.

Shiba Inu Faces Paralysis: Will Market Activity Ever Return?

2025/10/25 19:13
3 min read

TLDR

  • Shiba Inu’s price stagnates near key support as market shows no significant movement or volatility.
  • On-chain data reveals minimal activity, with Netflow and Exchange Reserve showing little change.
  • Shiba Inu remains trapped in low liquidity, awaiting a potential breakout or macro catalyst.
  • RSI remains flat, indicating no substantial buying or selling pressure in the Shiba Inu market.
  • Market participants are inactive, with no major whale movements or investor attention.

The Shiba Inu (SHIB) market has entered a phase of stagnation. Price action and on-chain data show no significant changes. Currently, SHIB is trading around $0.0000109, slightly above key support at $0.0000095.

Shiba Inu Price Action Remains Stagnant

Shiba Inu has shown little movement in its price. The current price of $0.0000109 hovers near a crucial local support level. This level at $0.0000095 has held firm in recent days, signaling potential for a bottom formation.

However, the price remains locked in a narrow range. Neither bulls nor bears have taken charge of the market. This lack of momentum is reflected in the low trading volume and volatility.

The Relative Strength Index (RSI) also supports this trend, remaining flat in the 37-40 range. This indicates no significant buying or selling pressure in the market. As a result, a sharp recovery seems unlikely without a catalyst.

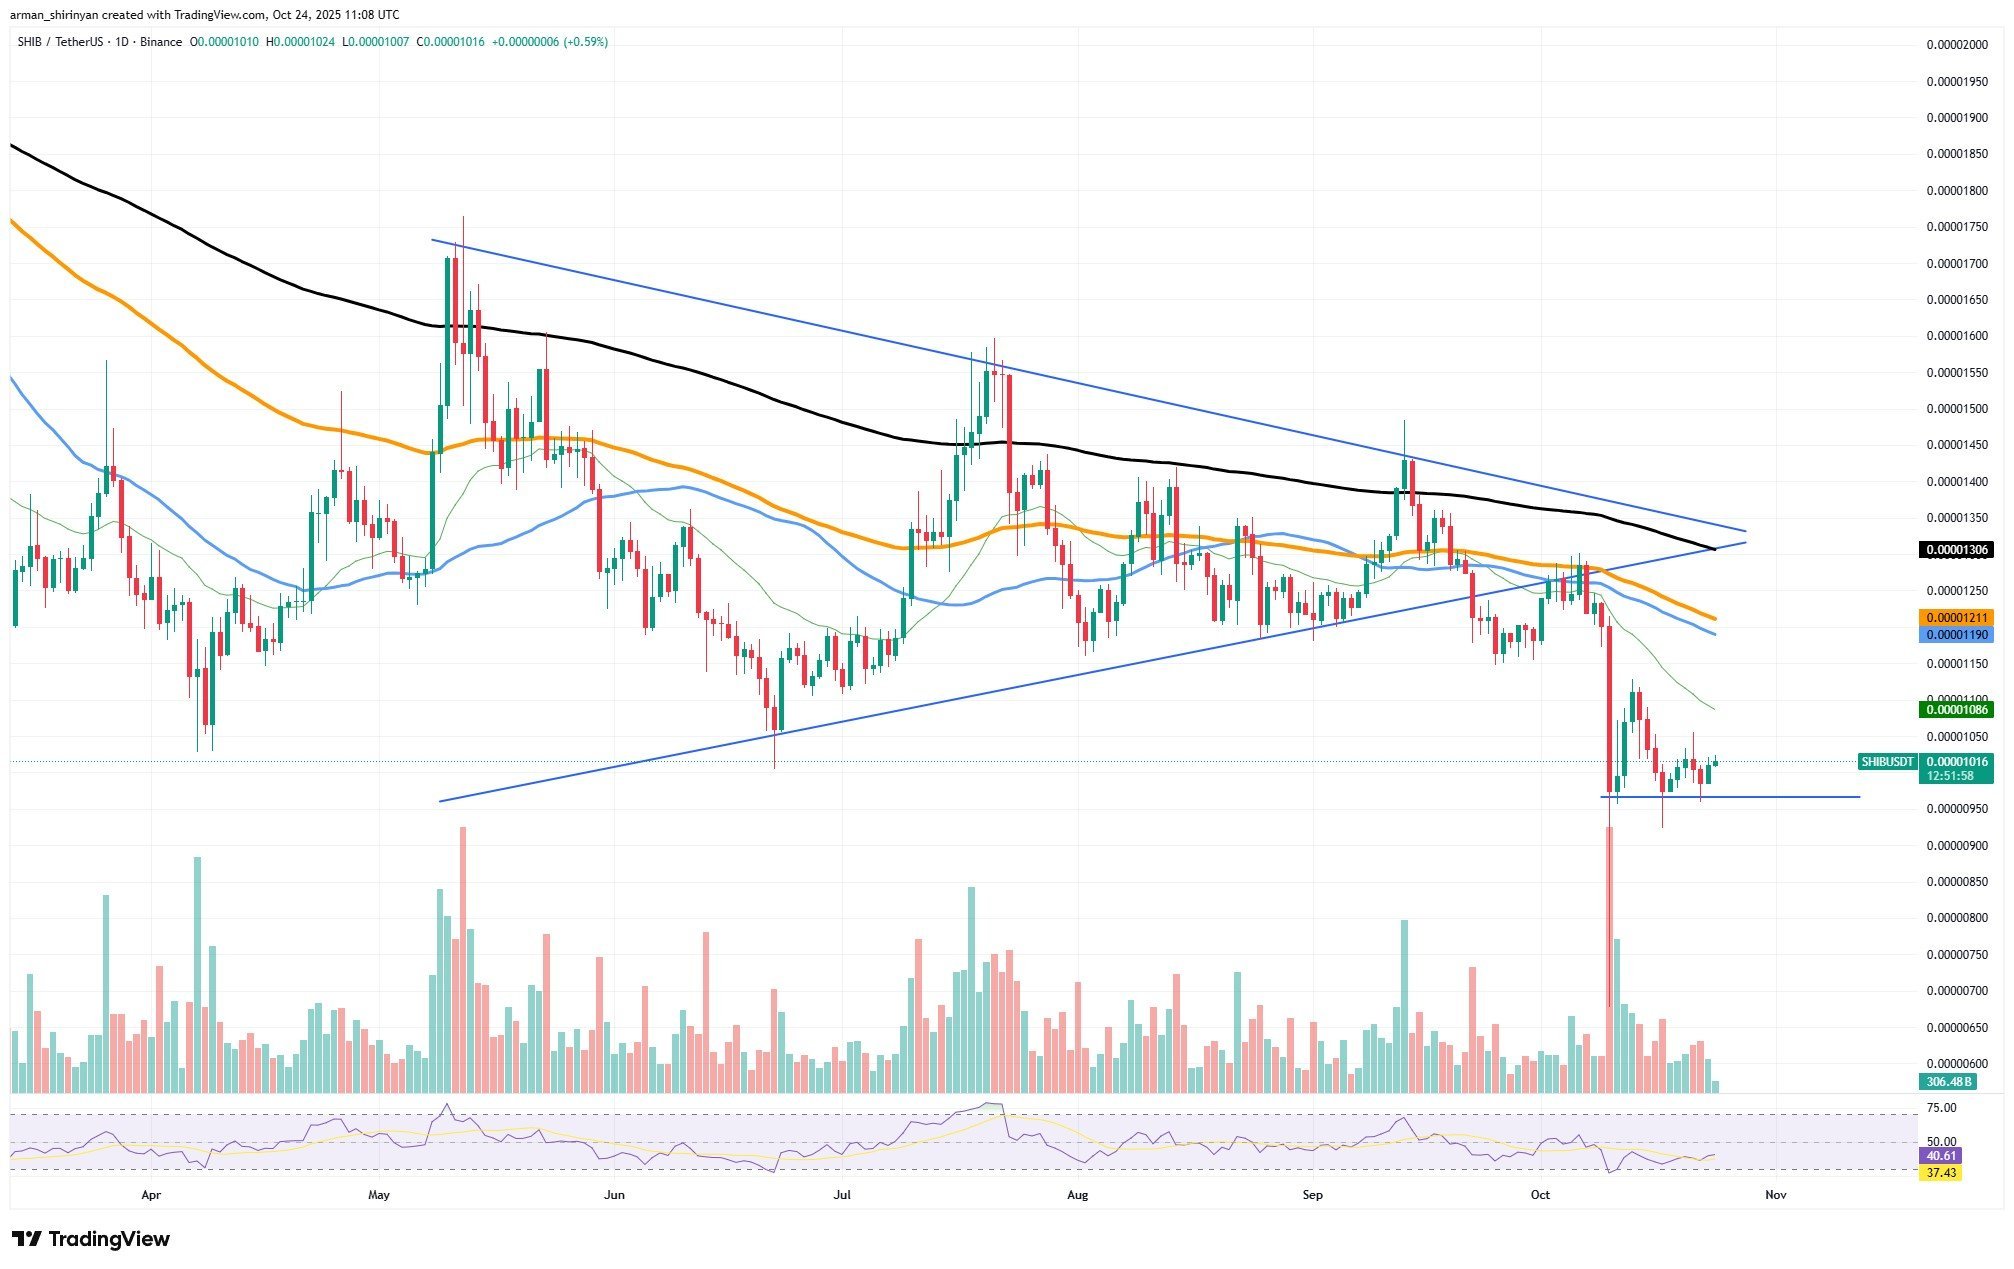
SHIB:USDT source: TradingView

On-Chain Data Shows Market Paralysis

On-chain metrics mirror the lack of movement in the Shiba Inu market. According to CryptoQuant data, Netflow Inflow and Outflow remain almost unchanged. This suggests minimal activity on exchanges.

The Exchange Reserve has increased by only +0.13%, indicating that coins are remaining on exchanges. Additionally, the Netflow is down by -0.34%, further confirming the market’s stagnation. “No substantial buying or selling is occurring,” said a market analyst.

This on-chain data highlights the lack of investor participation. Whale activity, including accumulation and liquidation, is non-existent. Shiba Inu remains trapped in this low-liquidity environment, awaiting a potential breakout.

With Shiba Inu’s current market condition, a clear direction remains uncertain. The token is not attracting significant attention from institutional investors or speculators. Without a surge in volume or inflows, SHIB could continue to move sideways.

The market’s next movement depends on a potential resurgence in volatility. However, until there is a significant shift, Shiba Inu will likely remain stuck in its current state. Traders and investors are waiting for a macro catalyst to drive the next move.

The post Shiba Inu Faces Paralysis: Will Market Activity Ever Return? appeared first on CoinCentral.

Market Opportunity
Everscale Logo
Everscale Price(EVER)
$0,00308
$0,00308$0,00308
-%0,64
USD
Everscale (EVER) Live Price Chart
Disclaimer: The articles reposted on this site are sourced from public platforms and are provided for informational purposes only. They do not necessarily reflect the views of MEXC. All rights remain with the original authors. If you believe any content infringes on third-party rights, please contact [email protected] for removal. MEXC makes no guarantees regarding the accuracy, completeness, or timeliness of the content and is not responsible for any actions taken based on the information provided. The content does not constitute financial, legal, or other professional advice, nor should it be considered a recommendation or endorsement by MEXC.

You May Also Like

Ethereum Price Prediction: ETH Targets $10,000 In 2026 But Layer Brett Could Reach $1 From $0.0058

Ethereum Price Prediction: ETH Targets $10,000 In 2026 But Layer Brett Could Reach $1 From $0.0058

Ethereum price predictions are turning heads, with analysts suggesting ETH could climb to $10,000 by 2026 as institutional demand and network upgrades drive growth. While Ethereum remains a blue-chip asset, investors looking for sharper multiples are eyeing Layer Brett (LBRETT). Currently in presale at just $0.0058, the Ethereum Layer 2 meme coin is drawing huge [...] The post Ethereum Price Prediction: ETH Targets $10,000 In 2026 But Layer Brett Could Reach $1 From $0.0058 appeared first on Blockonomi.
Share
Blockonomi2025/09/17 23:45
Whales Dump 200 Million XRP in Just 2 Weeks – Is XRP’s Price on the Verge of Collapse?

Whales Dump 200 Million XRP in Just 2 Weeks – Is XRP’s Price on the Verge of Collapse?

Whales offload 200 million XRP leaving market uncertainty behind. XRP faces potential collapse as whales drive major price shifts. Is XRP’s future in danger after massive sell-off by whales? XRP’s price has been under intense pressure recently as whales reportedly offloaded a staggering 200 million XRP over the past two weeks. This massive sell-off has raised alarms across the cryptocurrency community, as many wonder if the market is on the brink of collapse or just undergoing a temporary correction. According to crypto analyst Ali (@ali_charts), this surge in whale activity correlates directly with the price fluctuations seen in the past few weeks. XRP experienced a sharp spike in late July and early August, but the price quickly reversed as whales began to sell their holdings in large quantities. The increased volume during this period highlights the intensity of the sell-off, leaving many traders to question the future of XRP’s value. Whales have offloaded around 200 million $XRP in the last two weeks! pic.twitter.com/MiSQPpDwZM — Ali (@ali_charts) September 17, 2025 Also Read: Shiba Inu’s Price Is at a Tipping Point: Will It Break or Crash Soon? Can XRP Recover or Is a Bigger Decline Ahead? As the market absorbs the effects of the whale offload, technical indicators suggest that XRP may be facing a period of consolidation. The Relative Strength Index (RSI), currently sitting at 53.05, signals a neutral market stance, indicating that XRP could move in either direction. This leaves traders uncertain whether the XRP will break above its current resistance levels or continue to fall as more whales sell off their holdings. Source: Tradingview Additionally, the Bollinger Bands, suggest that XRP is nearing the upper limits of its range. This often points to a potential slowdown or pullback in price, further raising concerns about the future direction of the XRP. With the price currently around $3.02, many are questioning whether XRP can regain its footing or if it will continue to decline. The Aftermath of Whale Activity: Is XRP’s Future in Danger? Despite the large sell-off, XRP is not yet showing signs of total collapse. However, the market remains fragile, and the price is likely to remain volatile in the coming days. With whales continuing to influence price movements, many investors are watching closely to see if this trend will reverse or intensify. The coming weeks will be critical for determining whether XRP can stabilize or face further declines. The combination of whale offloading and technical indicators suggest that XRP’s price is at a crossroads. Traders and investors alike are waiting for clear signals to determine if the XRP will bounce back or continue its downward trajectory. Also Read: Metaplanet’s Bold Move: $15M U.S. Subsidiary to Supercharge Bitcoin Strategy The post Whales Dump 200 Million XRP in Just 2 Weeks – Is XRP’s Price on the Verge of Collapse? appeared first on 36Crypto.
Share
Coinstats2025/09/17 23:42
SUI Price Eyes Breakout, Targets $11 Says Analyst

SUI Price Eyes Breakout, Targets $11 Says Analyst

The post SUI Price Eyes Breakout, Targets $11 Says Analyst appeared on BitcoinEthereumNews.com. SUI price shows a technical setup for a macro breakout with analyst Dan Gambardello targeting $10-$11 levels. Recent partnership with Google’s Agentic Payments Protocol adds fundamental support to the technical analysis as SUI moves closer to potential breakout levels. SUI Price Analysis Points to $10-$11 Breakout Target Dan Gambardello has identified a clear ascending triangle formation on SUI price daily chart with upside targets around $10.79. The analyst simplified this target range to $10-$11 for practical trading purposes. The pattern shows sustained higher lows meeting resistance at current levels before a potential breakout. VanEck maintains more aggressive SUI crypto targets ranging from $13-$25 according to Gambardello’s research. SUI Price Analysis | Source: Dan Gambardello, X The $10 level is a more conservative higher high area for the current cycle. Midterm targets point to $7.50 in the 1.618 Fibonacci extension zone before longer-term objectives. The monthly RSI shows extreme compression that Gambardello describes as “screaming for a macro breakout to the upside.” This momentum oscillator behavior typically precedes major price movements in the crypto market. SUI crypto risk model currently sits at 51 and matches pre-bull market levels seen in coins like Ethereum. Gambardello compared this to Ethereum’s December 2020 reading of 51 before its major breakout. The March 2017 Ethereum reading of 53 preceded that cycle’s parabolic move. The analyst also noted that SUI price trades near the same levels from almost a year ago in November 2024. Bollinger Bands Signal Historic Compression CryptoBullet has identified the tightest Bollinger Bands in SUI’s entire trading history on the weekly chart. The BBW indicator compression reached levels that were historically followed by major price movements. This setup mirrors conditions before SUI’s previous major rallies. Historical data shows SUI price delivered +253% gains between December 2023 and March 2024 following similar compression. SUI…
Share
BitcoinEthereumNews2025/09/18 11:32