Toncoin (TON) hits pause to a two-day pullback of over 10% near the 50-day Exponential Moving Average (EMA) at $3.182, but the near-term outlook remains tilted to the downside.Toncoin (TON) hits pause to a two-day pullback of over 10% near the 50-day Exponential Moving Average (EMA) at $3.182, but the near-term outlook remains tilted to the downside.

Toncoin Price Forecast: TON risks further losses below the 50-day EMA as bearish momentum increases

2025/08/06 16:10
2 min read
For feedback or concerns regarding this content, please contact us at [email protected]
  • Toncoin’s double-digit drop in the past two days puts the 50-day EMA support at risk.
  • The TON Open Interest falls 10% in 24 hours, signaling increasing doubts among traders.
  • The technical outlook indicates significant downside risk as the MACD indicator flashes a sell signal.

Toncoin (TON) hits pause to a two-day pullback of over 10% near the 50-day Exponential Moving Average (EMA) at $3.182, but the near-term outlook remains tilted to the downside. TON Open Interest dropped by 10% in the last 24 hours as doubts increase among traders, while the technical outlook indicates a bearish bias as the MACD indicator flashes a sell signal. 

Open Interest drops 10% as investors lose interest 

Toncoin investors are on edge as it ranks among the cryptocurrencies with the worst performance over the last 24 hours. Investors are pulling capital out of the Toncoin derivatives market, ignoring the $558 million TON treasury commitment by the recently NASDAQ-listed company Verb Technology. 

CoinGlass data shows Toncoin futures and options with an Open Interest (OI) drop of 10% to $379.65 million from $421.08 million on Tuesday. 

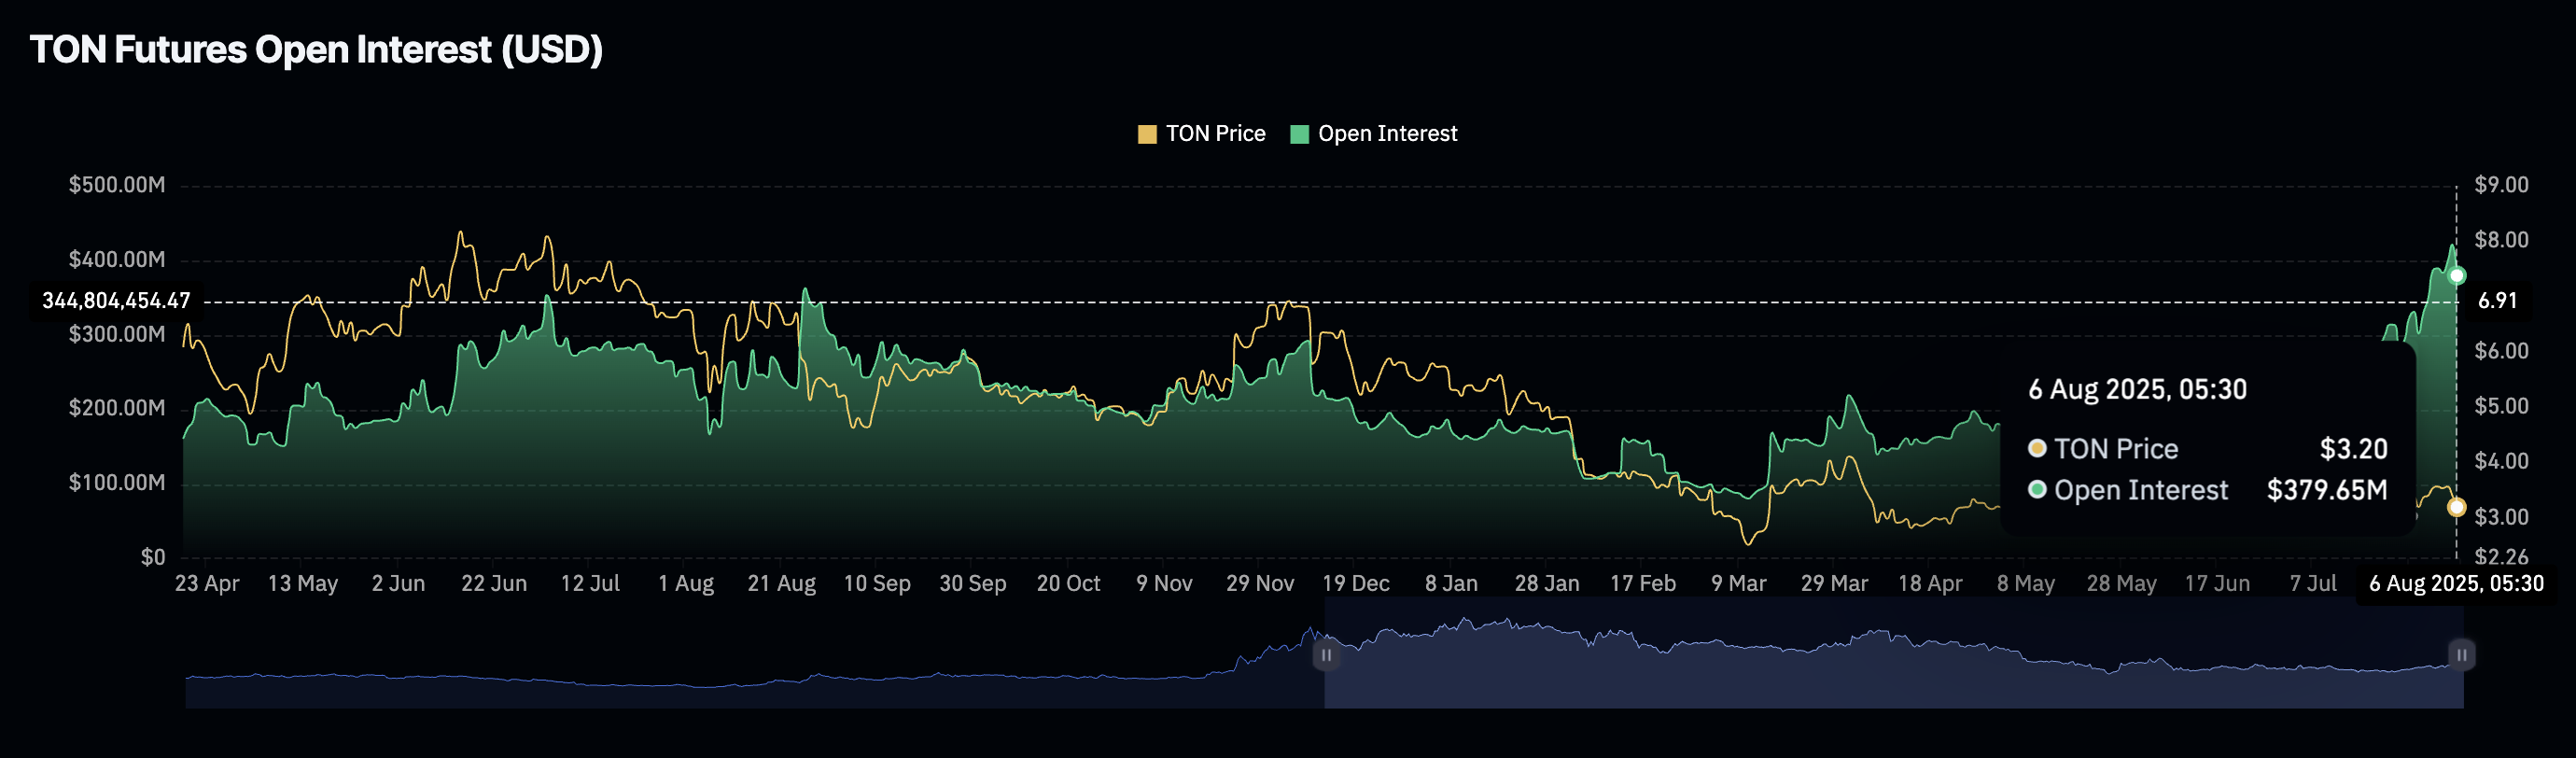
Toncoin Open Interest. Source: Coinglass

Toncoin risks further losses as the MACD sirens sell signal

Toncoin prints two consecutive bearish candles for a 10% drop from the 200-day EMA to the 50-day EMA. At the time of writing, TON holds above this dynamic support after visiting a daily low of $3.140 so far on Wednesday. 

Toncoin could face further selling pressure as the Moving Average Convergence Divergence (MACD) crossed below its signal line on Tuesday, flashing a sell signal. Adding credence to the declining scenario, the Relative Strength Index (RSI) has fallen to 46, below the halfway line, indicating a decrease in buying pressure. 

A decisive close below the 50-day EMA at $3.182 could extend the decline to $2.968, which was last tested on July 15. 

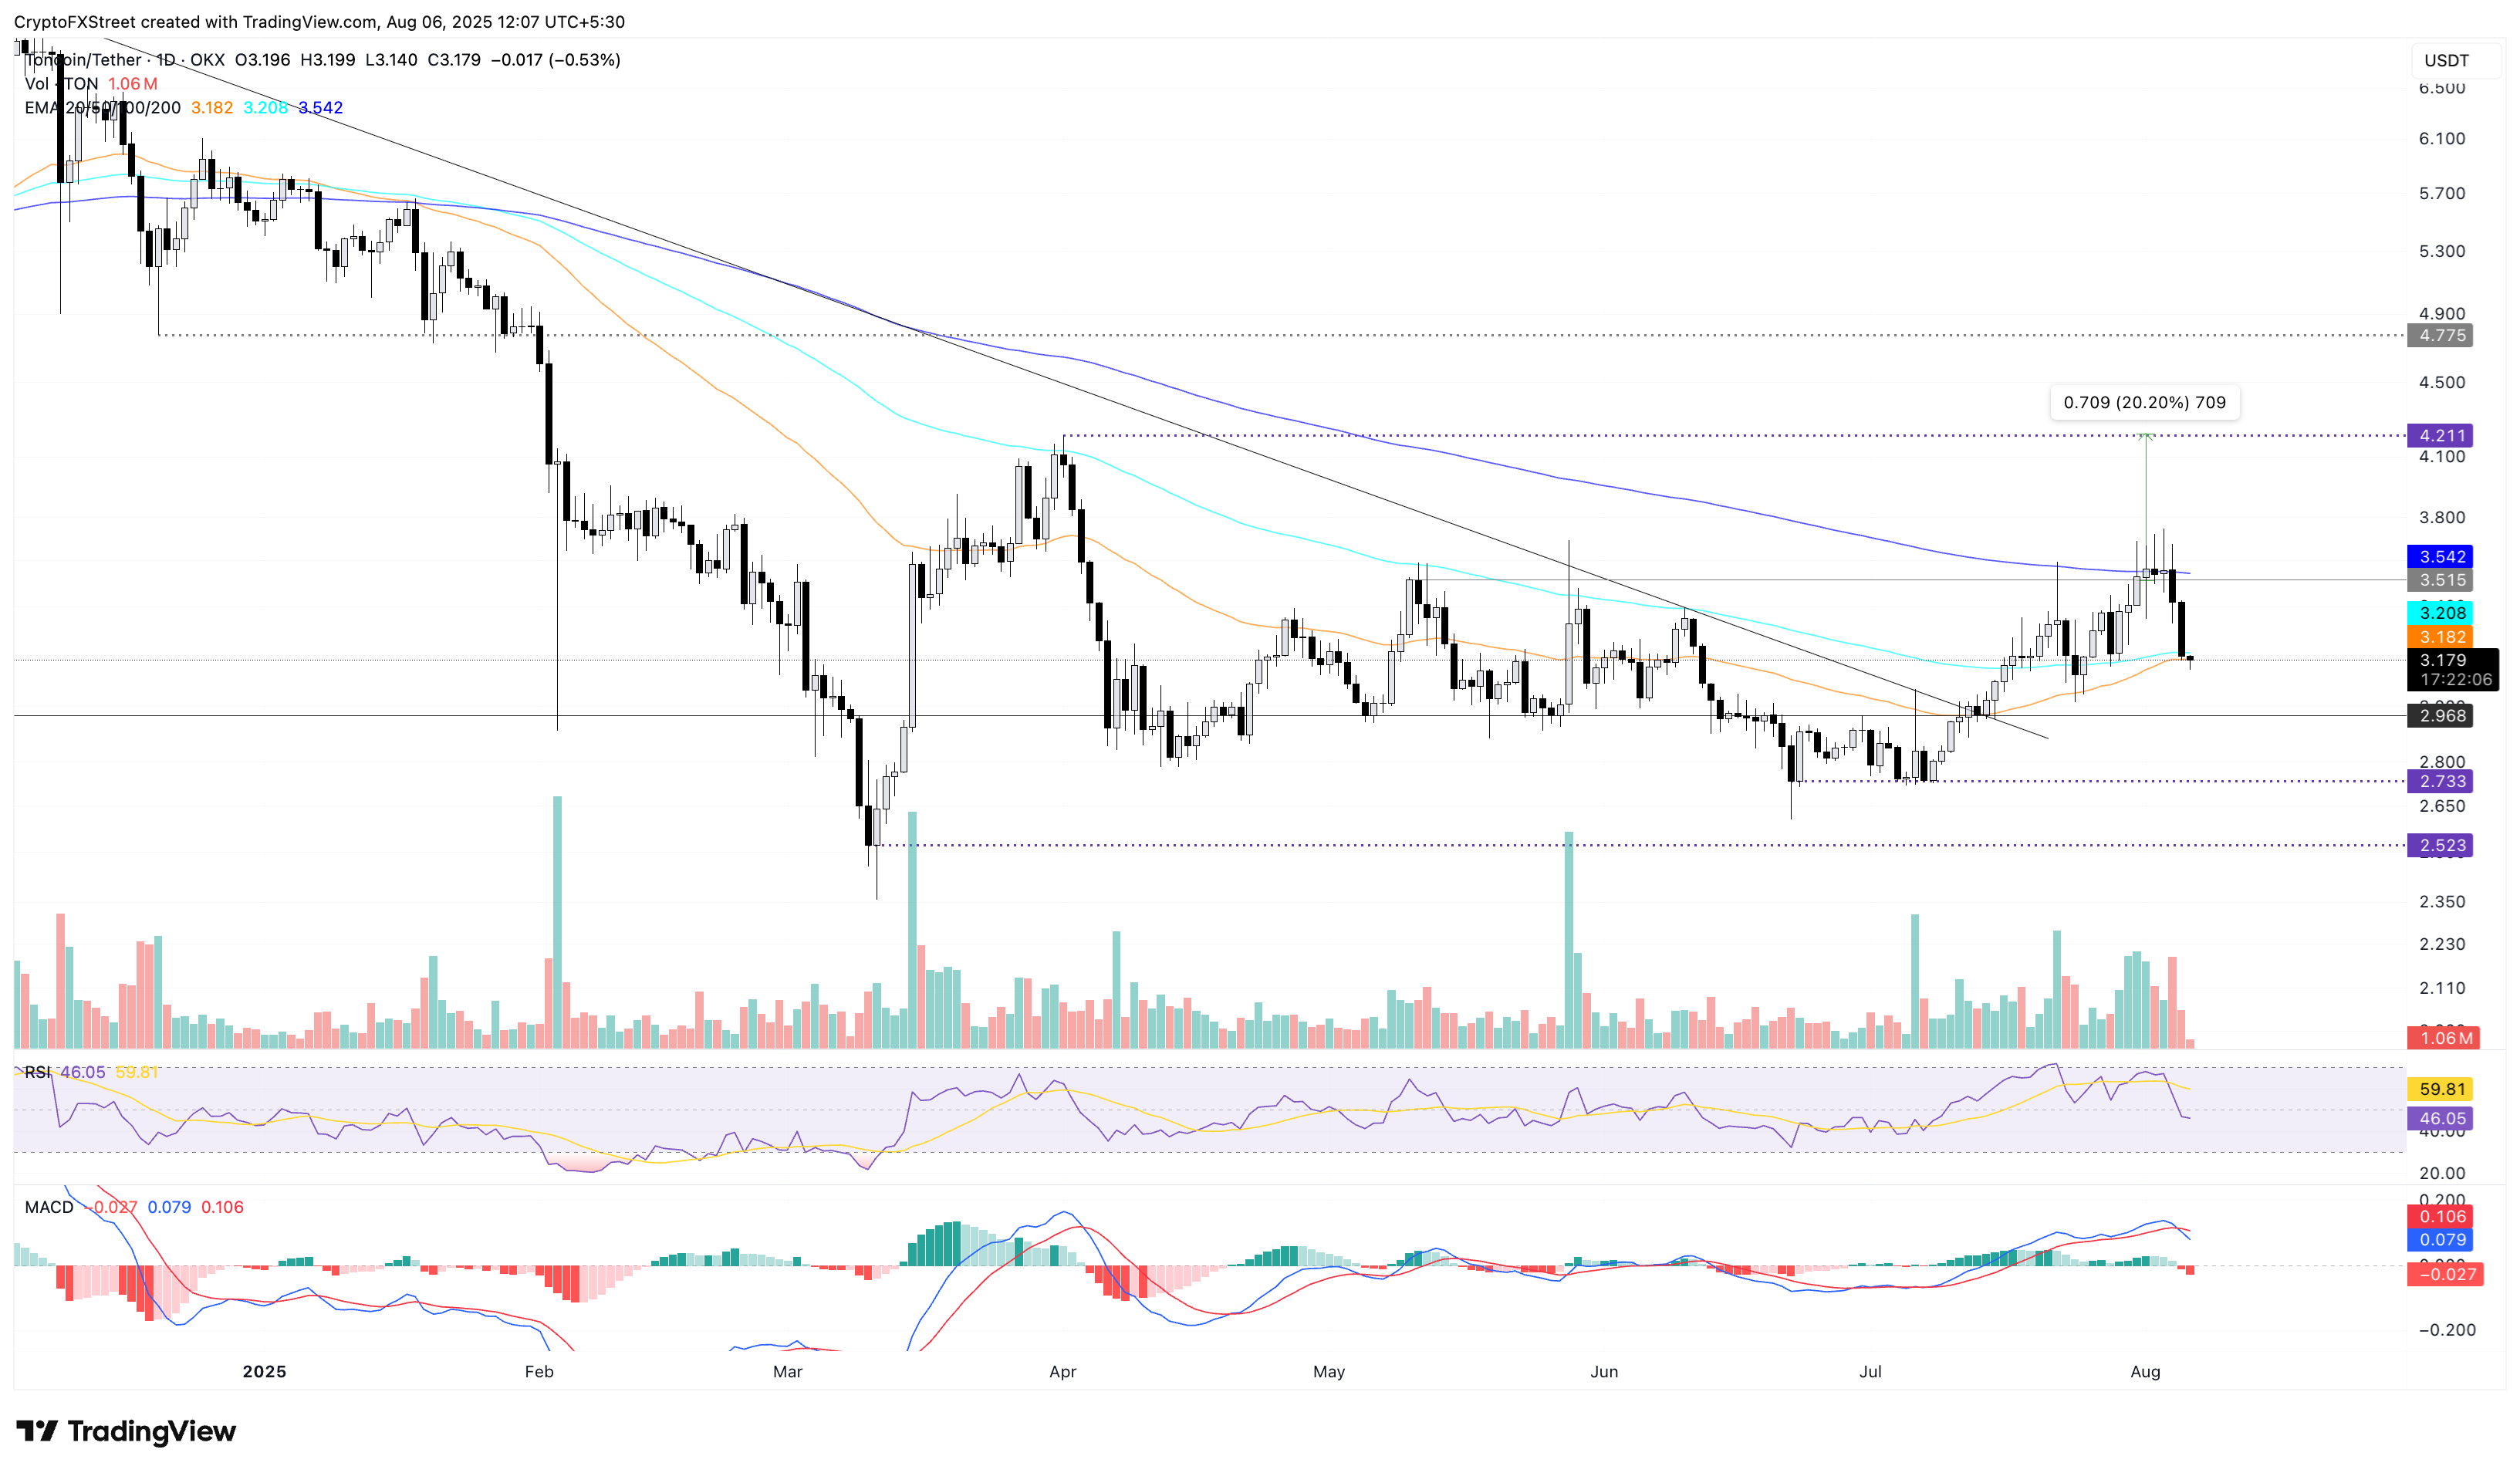
TON/USDT daily price chart.

Looking up, if Toncoin bounces off the 50-day EMA, it could rally back to the 200-day EMA at $3.543.


Market Opportunity
NEAR Logo
NEAR Price(NEAR)
$1.4511
$1.4511$1.4511
+2.64%
USD
NEAR (NEAR) Live Price Chart
Disclaimer: The articles reposted on this site are sourced from public platforms and are provided for informational purposes only. They do not necessarily reflect the views of MEXC. All rights remain with the original authors. If you believe any content infringes on third-party rights, please contact [email protected] for removal. MEXC makes no guarantees regarding the accuracy, completeness, or timeliness of the content and is not responsible for any actions taken based on the information provided. The content does not constitute financial, legal, or other professional advice, nor should it be considered a recommendation or endorsement by MEXC.

You May Also Like

South Korea Moves to Block Illegal Crypto FX Flows

South Korea Moves to Block Illegal Crypto FX Flows

South Korea is taking a strong step to stop illegal money flows linked to crypto. On March 17, the country’s Financial Supervisory Service (FSS) teamed up with
Share
Coinfomania2026/03/17 19:56
The Mybluechip.com

The Mybluechip.com

The Mybluechip.com Nightmare: How a Washington Marketer Lost $23,440 to a T. Rowe Price Impersonator and Its “Recovery” Follow-Up Scam SEATTLE, WASHINGTON Edito
Share
Medium2026/03/17 20:38
200,000,000 XRP out in 2 Weeks: What’s Going On?

200,000,000 XRP out in 2 Weeks: What’s Going On?

The post 200,000,000 XRP out in 2 Weeks: What’s Going On? appeared on BitcoinEthereumNews.com. In the last 14 days, wallets with between 1,000,000 and 10,000,000 XRP have reduced their holdings by around 200,000,000 tokens. This change, displayed by Santiment data, suggests that some of these holders are leaving the mid-level group, reducing their combined holdings to around 6.74 billion XRP.  They are not small retail accounts, but they also do not match the scale of the very largest XRP players.  Such movements usually matter because of the amount of supply in control, which can influence short-term trends. Of late, these whales have clearly been reducing their holdings. The XRP price has been trending down while XRP has been levitating close to $3, bouncing between $2.90 and $3.30, without going in a clear direction.  The fact that these wallets are selling could be one of the reasons why the token has struggled to increase in value, even though the general crypto market has had a mix of positive and negative days. Why do XRP whales sell? One possibility is that these holders are simply taking profit after XRP’s climb earlier in the summer.  Another reason is caution: with the Federal Reserve’s interest rate decision coming up and money availability across markets looking uncertain, some investors may prefer to derisk their exposure now instead of holding amid price chaos. It is important to know that not all of these tokens have been moved to cold storage.  The number of XRP going into exchanges has gone up, which suggests that some of the 200 million XRP has been sent to trading platforms. This means that some of the selling pressure could be transferred to the open market if those tokens are moved directly there. Source: https://u.today/200000000-xrp-out-in-2-weeks-whats-going-on
Share
BitcoinEthereumNews2025/09/18 08:45