Top meme coins extend recent losses on Wednesday, with the segment’s market capitalization standing at $54.41 billion, a decline of over 20% in the past month.Top meme coins extend recent losses on Wednesday, with the segment’s market capitalization standing at $54.41 billion, a decline of over 20% in the past month.

Top Meme Coins Price Prediction: Dogecoin, Shiba Inu, Pepe set to extend losses

  • Dogecoin extends losses for the eighth consecutive day on Wednesday, indicating a surge in bearish momentum. 
  • Shiba Inu experienced an intense pullback on Tuesday, recording a two-month low, which increases downside risk.
  • Pepe clings to a crucial psychological support level while rising selling pressure could catalyze the next fall. 

Top meme coins extend recent losses on Wednesday, with the segment’s market capitalization standing at $54.41 billion, a decline of over 20% in the past month. Dogecoin (DOGE) and Shiba Inu (SHIB) are down 3% so far this week, while Pepe (PEPE) is down over 8% as market-wide selling pressure increases due to rising geopolitical tensions in the Middle East.

Dogecoin risks a drop below $0.15

Dogecoin edges lower by over 1% on Wednesday, extending losses for the eighth consecutive day, accounting for nearly 15%. With a plunge of approximately 2% on Tuesday, the meme coin recorded a low of $0.1639, the lowest price in six weeks. 

The path of least resistance cautions a steeper price action, risking the $0.1642 support level, marked by the May 6 low. If the Dogecoin bulls fail to hold a daily closing above $0.1642, DOGE’s decline could extend towards the $0.1428 level, last tested on April 8. 

The momentum indicators flash a sell signal as bearish dominance grows over the daily chart. The Moving Average Convergence/Divergence (MACD) indicator displays a declining trend that crosses deeply into negative territory, with its signal line mirroring the drop, indicating a growing selling pressure. 

The Relative Strength Index (RSI) at 35 slips towards the oversold region, signaling a gradual increase in bearish momentum. 

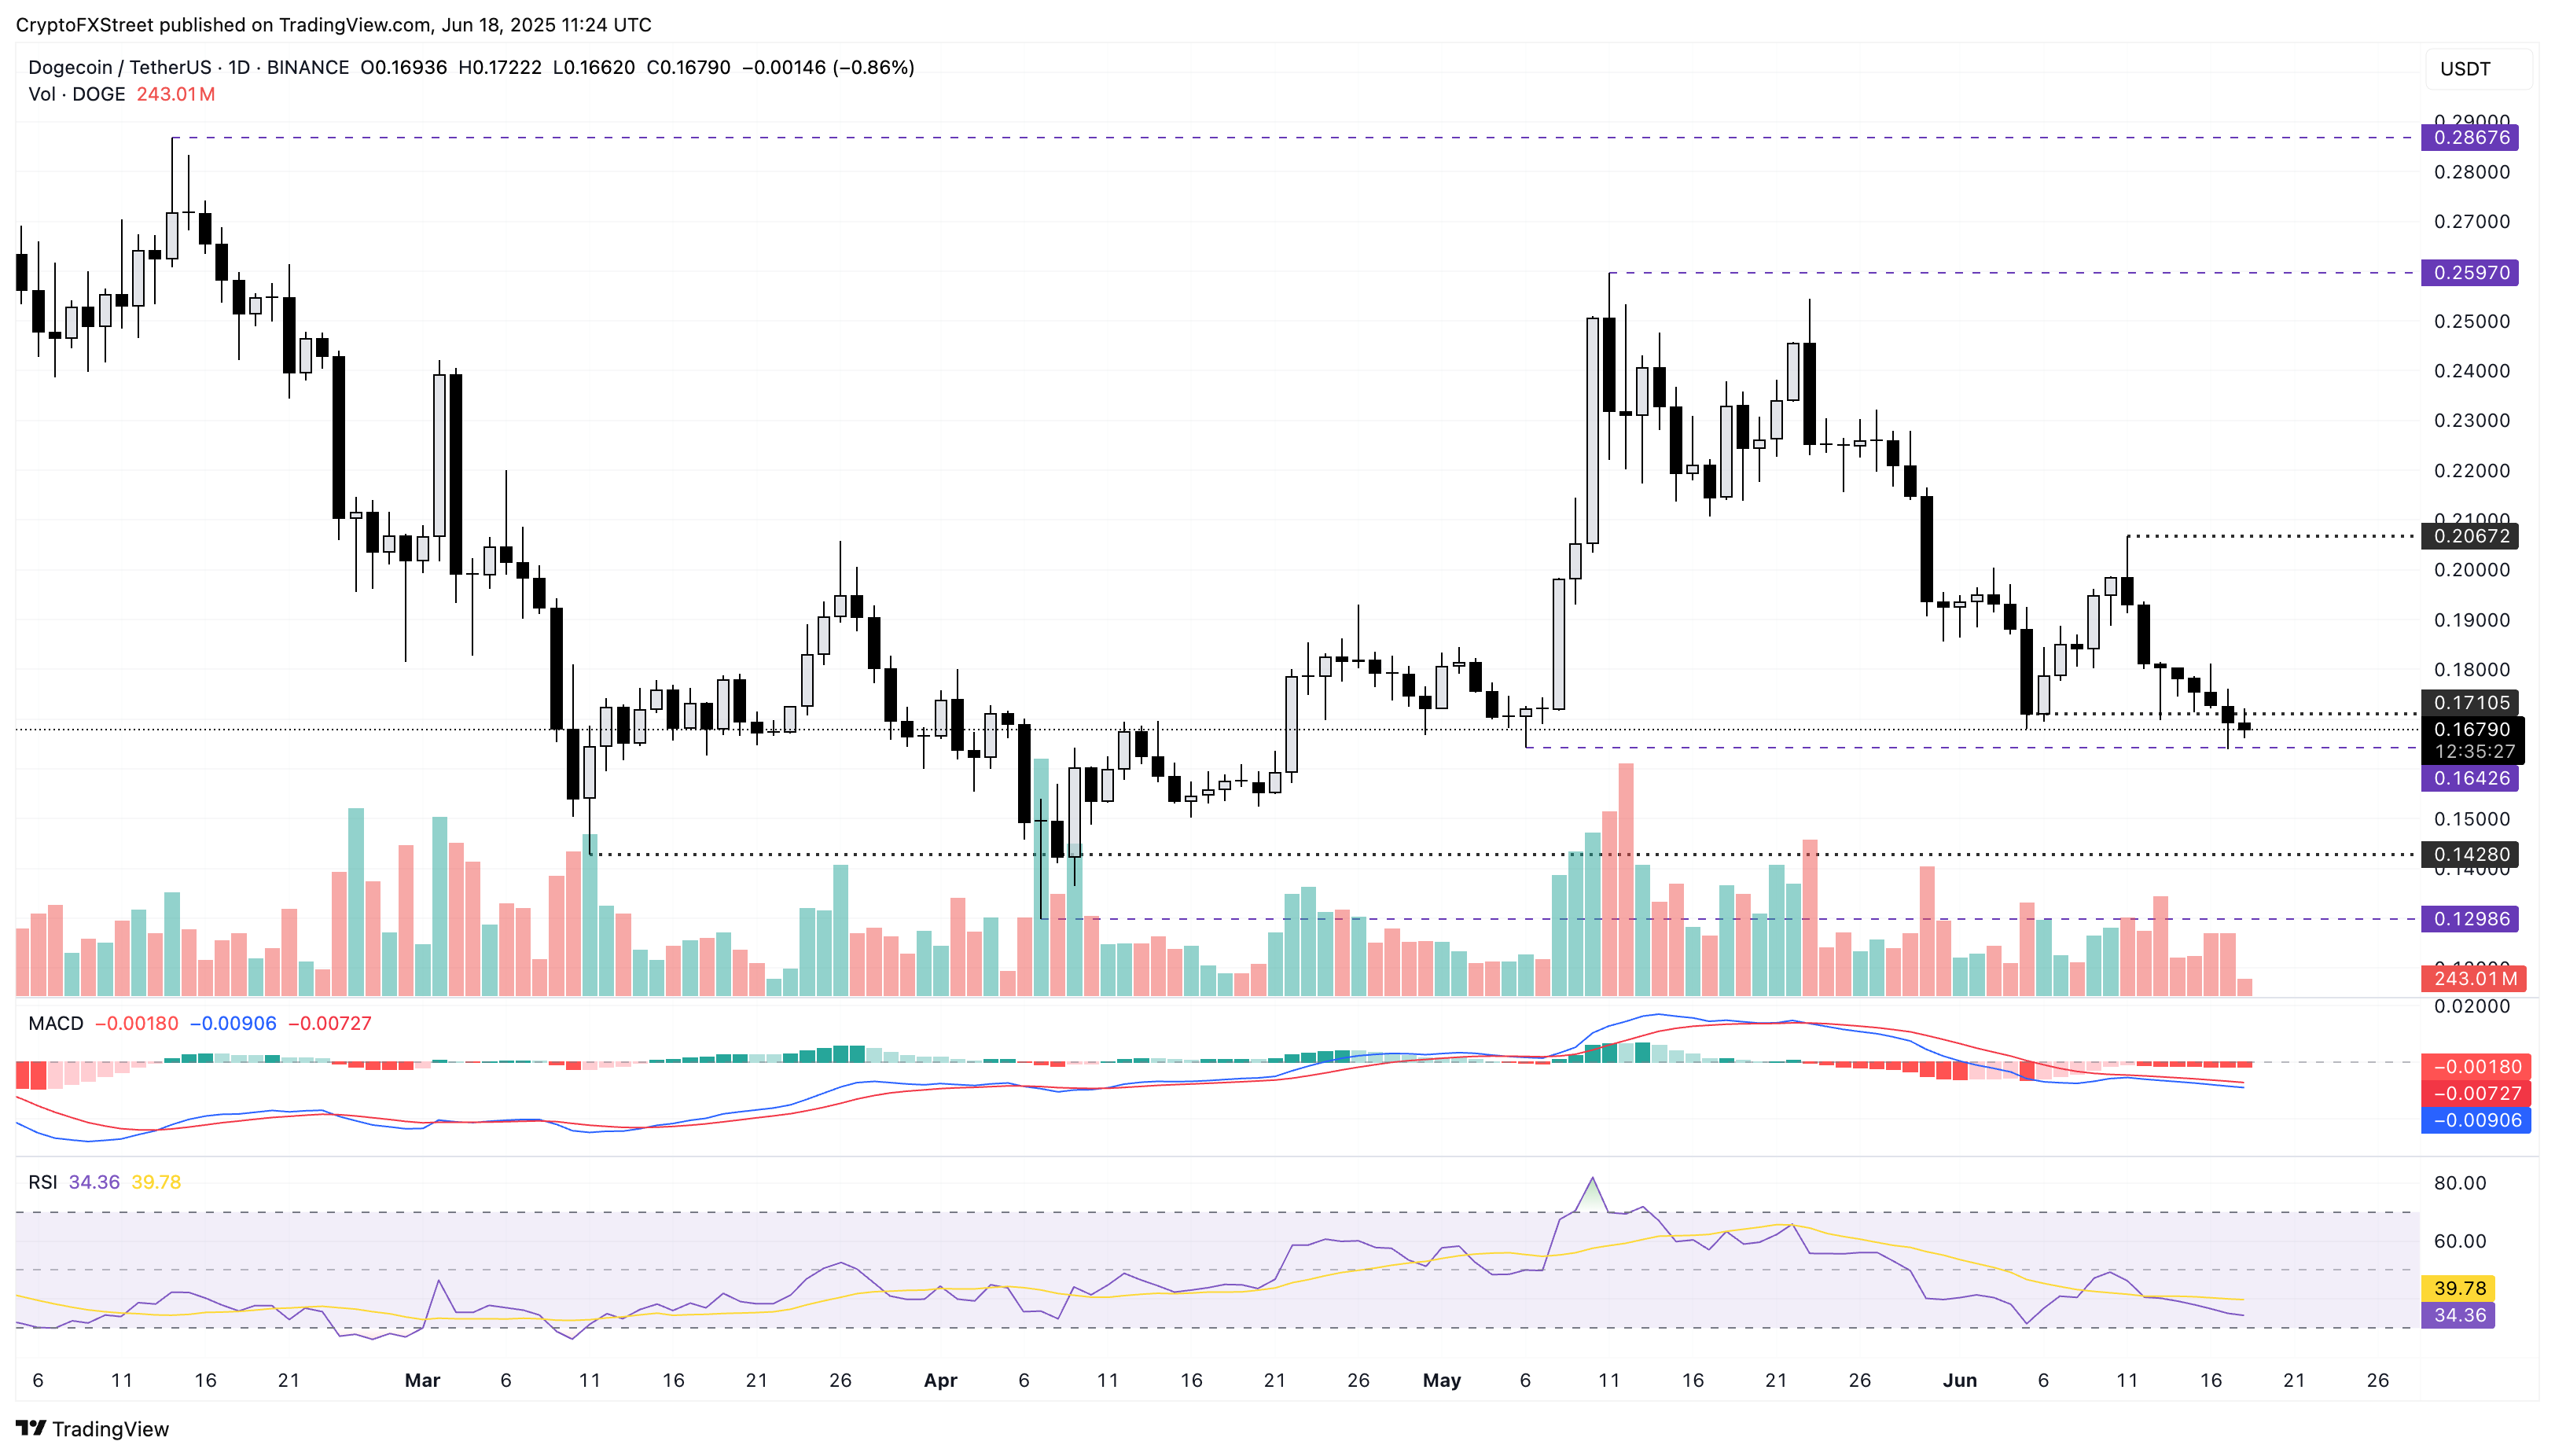
DOGE/USDT daily price chart.

If Dogecoin holds above $0.1642, a reversal could rise toward the monthly high of $0.2067. 

Shiba Inu set to extend its bearish trend

Shiba Inu strikingly mimics Dogecoin, marking the eighth consecutive bearish candle as it holds above the $0.000010 support, the lowest closing in March. The underperforming meme coin hit a two-month low of $0.00001134 on Tuesday.

Despite avoiding a daily candle close below the $0.00001150 support, Shiba Inu’s chances of reversal are getting slimmer. A closing under this level could prolong SHIB’s downfall towards $0.00001029, the year-to-date low.

The momentum indicators are bearish on Shiba Inu as the daily RSI is at 36, inching closer to the oversold zone. The falling MACD indicator, now in negative territory with its signal line, mirrors the bearish trigger seen in Dogecoin. 

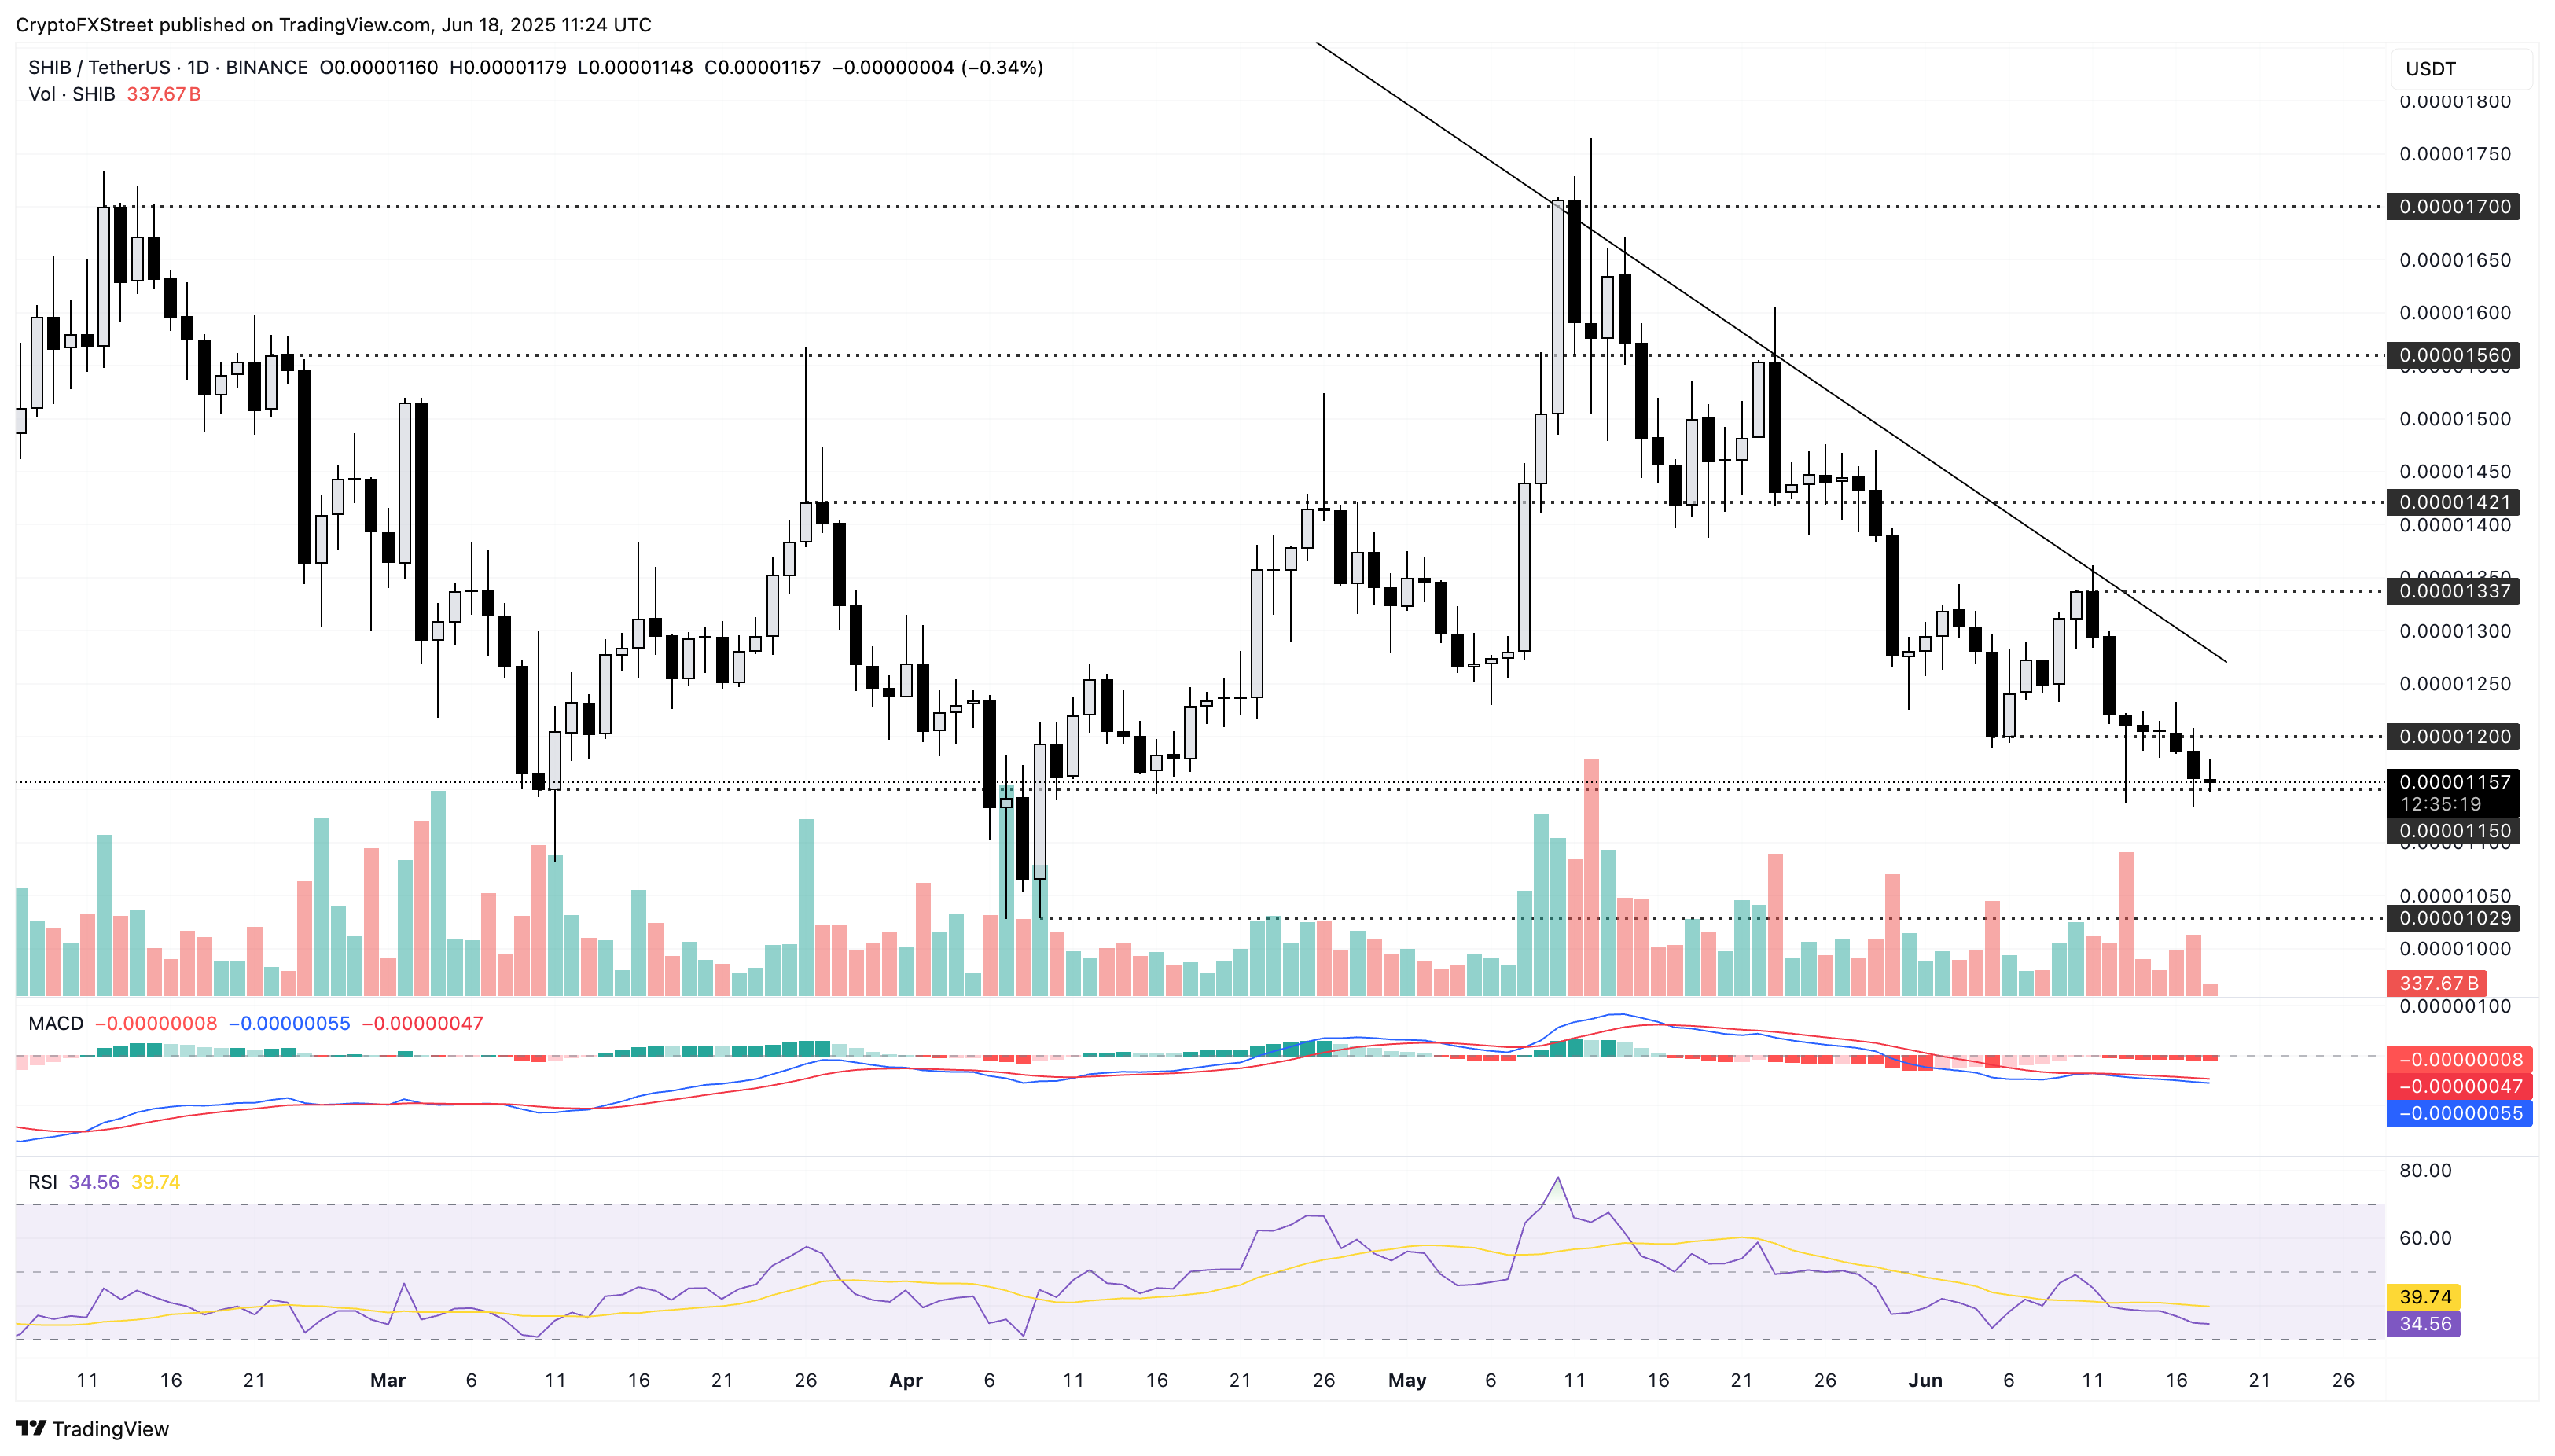
SHIB/USDT daily price chart.

On the contrary, a potential bounceback in Shiba Inu could test the $0.00001200 level marked by the June 5 closing. 

PEPE risks losing its psychological support

Pepe is struggling to float above its $0.00001000 psychological support. However, the meme coin is down nearly 10% so far this week, flashing a bearish trend as the path of least resistance. 

The declining meme coin could close the daily candle below the $0.00001000 psychological support. In such a scenario, PEPE could test the support zone near $0.00000900, marked by a green band on the daily chart, last tested on April 26.

As the PEPE/USDT pair falls, the momentum indicator signals a bearish bias. The RSI at 38 draws closer to the oversold zone while the MACD indicator declines with a fresh wave of bearish histograms. 

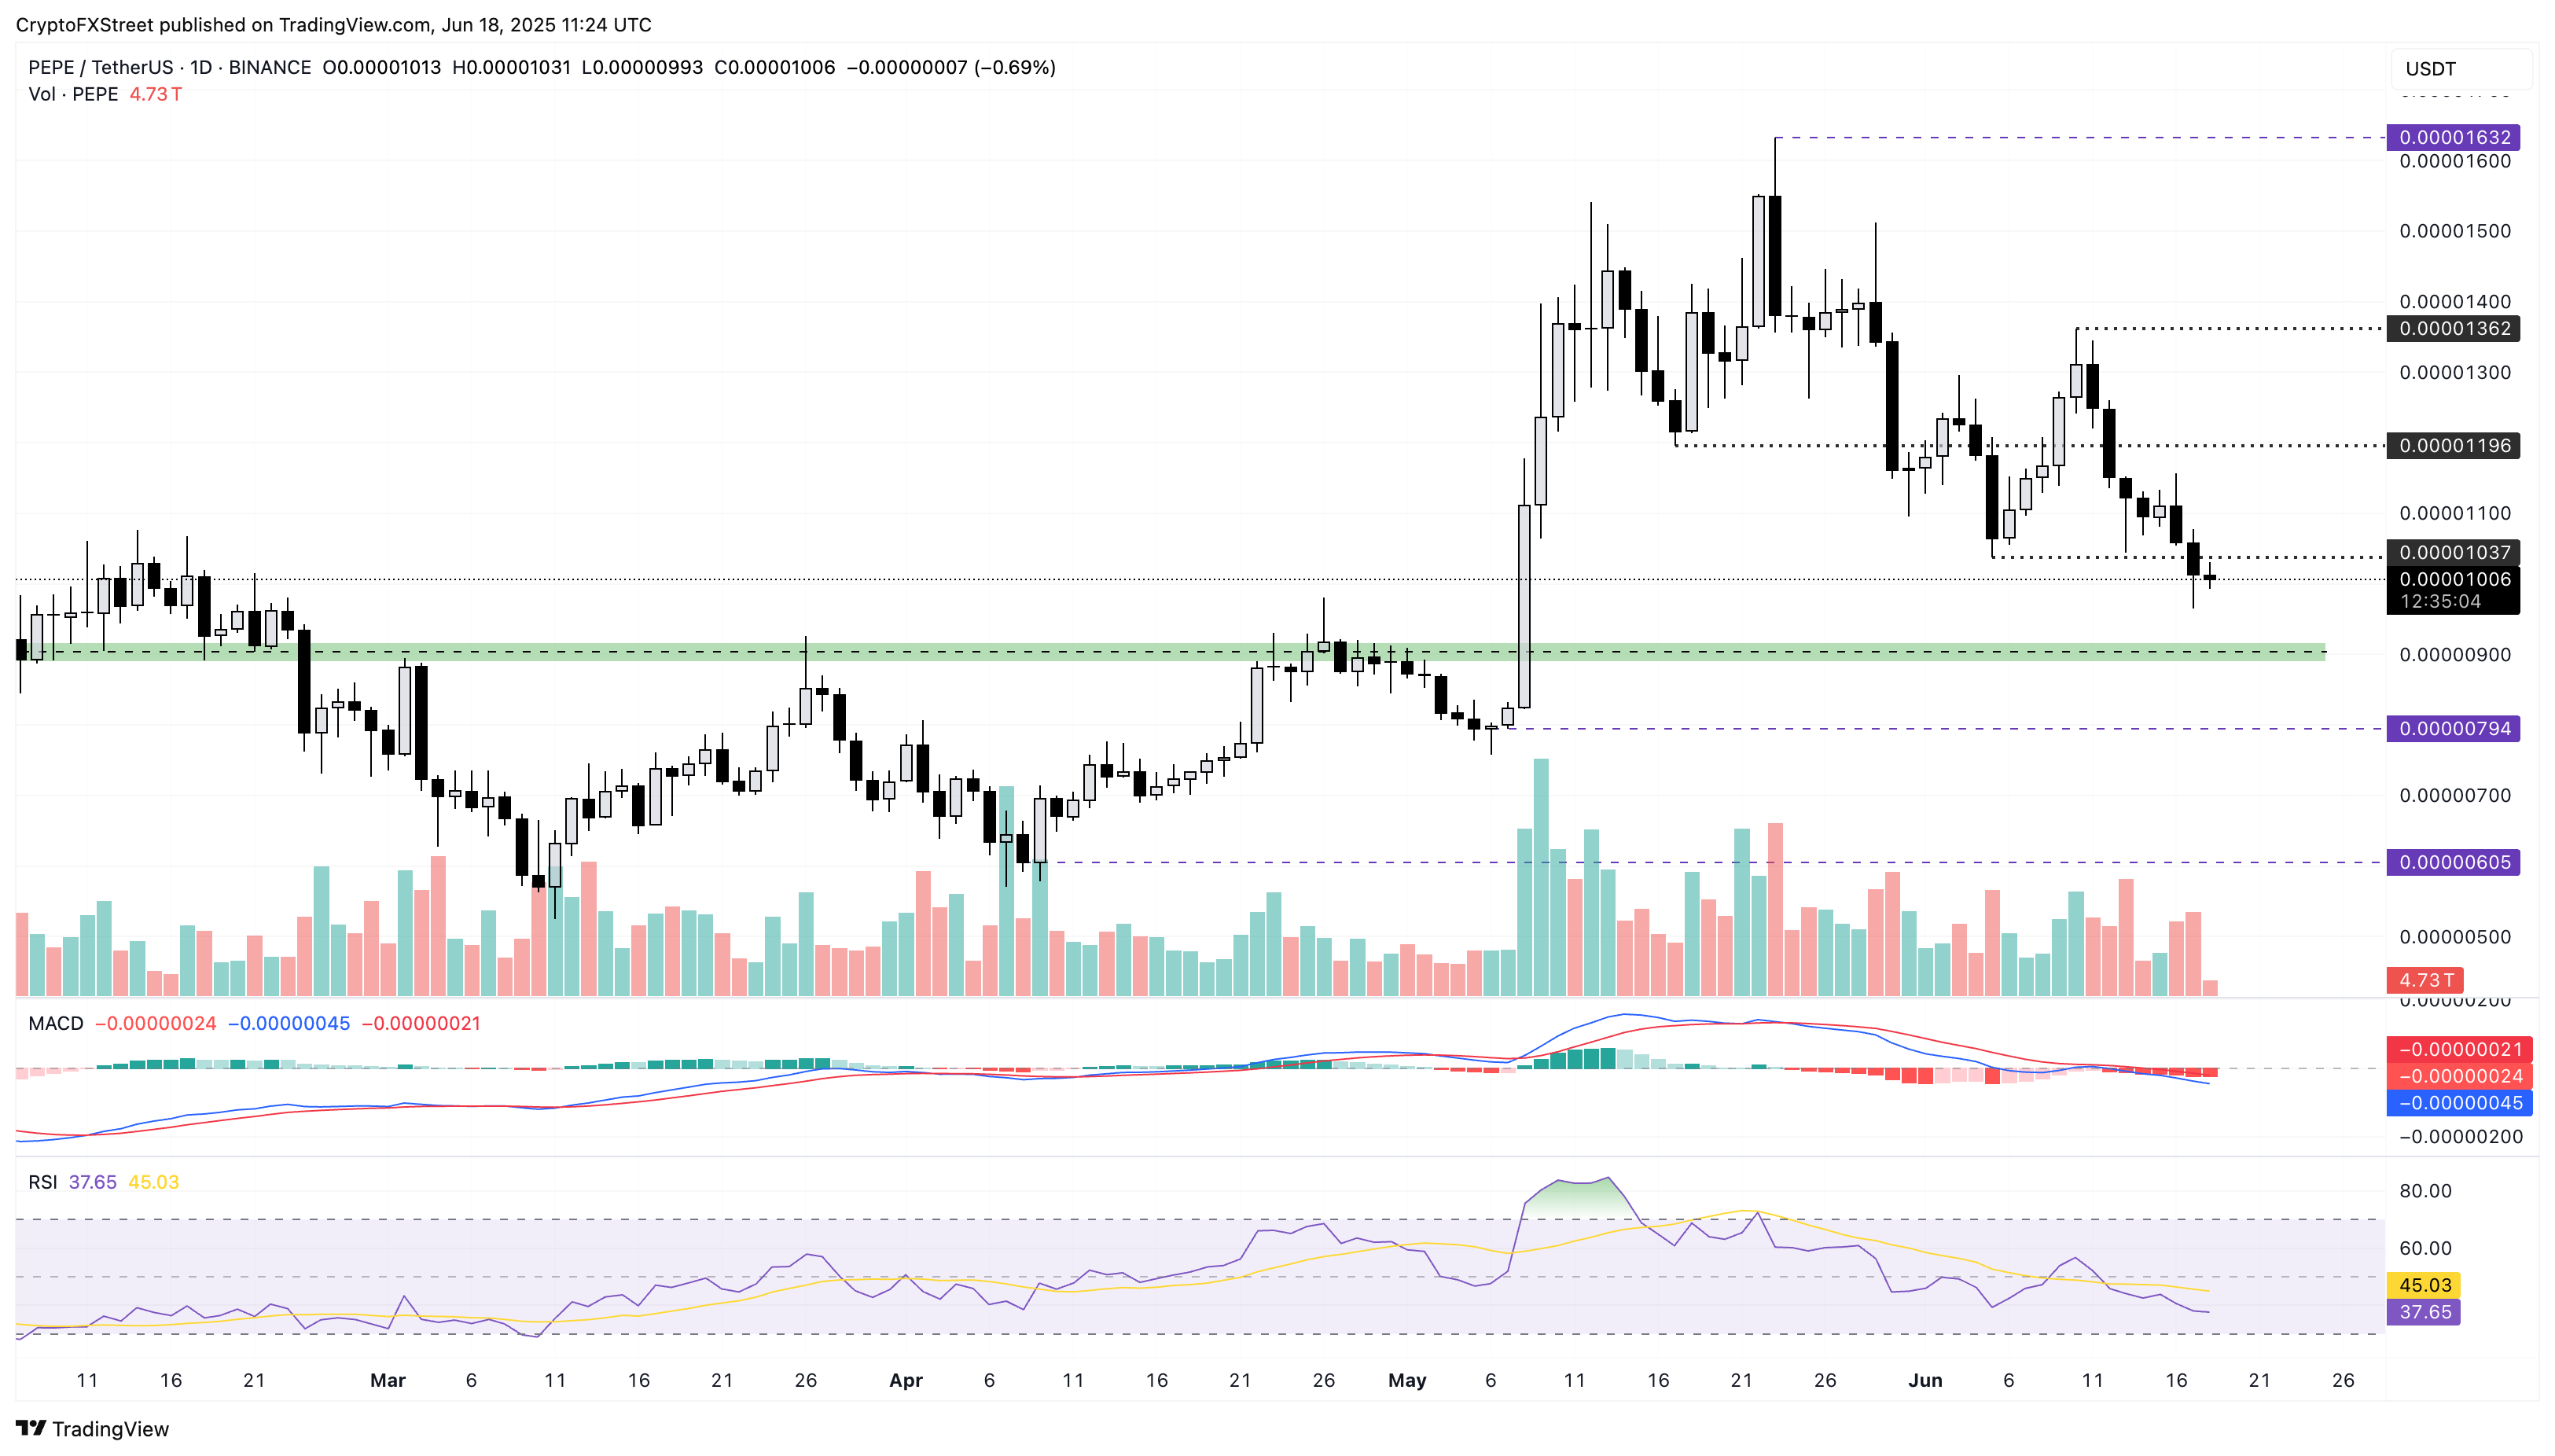
PEPE/USDT daily price chart.

If the tensions ease in the Middle East, stability in the broader cryptocurrency market could help Pepe float above $0.00001000. If so, Pepe could retest the $0.00001196 level marked by the May 17 low. 


Market Opportunity
TOP Network Logo
TOP Network Price(TOP)
$0.000096
$0.000096$0.000096
0.00%
USD
TOP Network (TOP) Live Price Chart
Disclaimer: The articles reposted on this site are sourced from public platforms and are provided for informational purposes only. They do not necessarily reflect the views of MEXC. All rights remain with the original authors. If you believe any content infringes on third-party rights, please contact [email protected] for removal. MEXC makes no guarantees regarding the accuracy, completeness, or timeliness of the content and is not responsible for any actions taken based on the information provided. The content does not constitute financial, legal, or other professional advice, nor should it be considered a recommendation or endorsement by MEXC.

You May Also Like

Russia’s Central Bank Prepares Crackdown on Crypto in New 2026–2028 Strategy

Russia’s Central Bank Prepares Crackdown on Crypto in New 2026–2028 Strategy

The Central Bank of Russia’s long-term strategy for 2026 to 2028 paints a picture of growing concern. The document, prepared […] The post Russia’s Central Bank Prepares Crackdown on Crypto in New 2026–2028 Strategy appeared first on Coindoo.
Share
Coindoo2025/09/18 02:30
Japanese Yen rises on safe-haven demand and intervention concerns

Japanese Yen rises on safe-haven demand and intervention concerns

The post Japanese Yen rises on safe-haven demand and intervention concerns appeared on BitcoinEthereumNews.com. The Japanese Yen (JPY) attracts some buyers at the
Share
BitcoinEthereumNews2025/12/22 11:49
Cryptos Signal Divergence Ahead of Fed Rate Decision

Cryptos Signal Divergence Ahead of Fed Rate Decision

The post Cryptos Signal Divergence Ahead of Fed Rate Decision appeared on BitcoinEthereumNews.com. Crypto assets send conflicting signals ahead of the Federal Reserve’s September rate decision. On-chain data reveals a clear decrease in Bitcoin and Ethereum flowing into centralized exchanges, but a sharp increase in altcoin inflows. The findings come from a Tuesday report by CryptoQuant, an on-chain data platform. The firm’s data shows a stark divergence in coin volume, which has been observed in movements onto centralized exchanges over the past few weeks. Bitcoin and Ethereum Inflows Drop to Multi-Month Lows Sponsored Sponsored Bitcoin has seen a dramatic drop in exchange inflows, with the 7-day moving average plummeting to 25,000 BTC, its lowest level in over a year. The average deposit per transaction has fallen to 0.57 BTC as of September. This suggests that smaller retail investors, rather than large-scale whales, are responsible for the recent cash-outs. Ethereum is showing a similar trend, with its daily exchange inflows decreasing to a two-month low. CryptoQuant reported that the 7-day moving average for ETH deposits on exchanges is around 783,000 ETH, the lowest in two months. Other Altcoins See Renewed Selling Pressure In contrast, other altcoin deposit activity on exchanges has surged. The number of altcoin deposit transactions on centralized exchanges was quite steady in May and June of this year, maintaining a 7-day moving average of about 20,000 to 30,000. Recently, however, that figure has jumped to 55,000 transactions. Altcoins: Exchange Inflow Transaction Count. Source: CryptoQuant CryptoQuant projects that altcoins, given their increased inflow activity, could face relatively higher selling pressure compared to BTC and ETH. Meanwhile, the balance of stablecoins on exchanges—a key indicator of potential buying pressure—has increased significantly. The report notes that the exchange USDT balance, around $273 million in April, grew to $379 million by August 31, marking a new yearly high. CryptoQuant interprets this surge as a reflection of…
Share
BitcoinEthereumNews2025/09/18 01:01