William Gann was one of the greatest financial traders of the 20th century and one of the pioneers of technical analysis. He created Gann Theory, which, along with Charles Dow's Dow Theory and RalphWilliam Gann was one of the greatest financial traders of the 20th century and one of the pioneers of technical analysis. He created Gann Theory, which, along with Charles Dow's Dow Theory and Ralph

What are Gann Squares?

Sep 21, 2026
2 min
Compartilhar

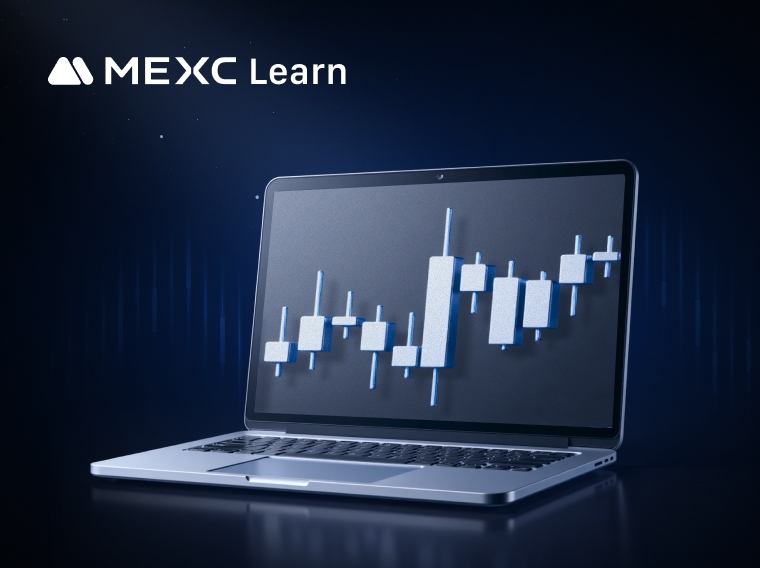
William Gann was one of the greatest financial traders of the 20th century and one of the pioneers of technical analysis. He created Gann Theory, which, along with Charles Dow's Dow Theory and Ralph Elliott's Elliott Wave Theory, is known as one of the "Three Great Traditional Theories" of technical analysis.

Gann Theory includes Gann Square, Gann Angles, Gann Wheel, and Gann Box, among others. The Gann Square is based on the Gann Wheel, which serves as the foundation for its price and time patterns. (Note: the Gann Wheel is used to predict market support and resistance levels, as well as reversal times for trends.) Generally, Gann Square is plotted by using historical low points or high points as starting points and calculating forward to predict key support and resistance levels. Additionally, you can combine it with Elliott Wave Theory, using the end of a five-wave pattern as a starting point for plotting. When using Gann Square, it is crucial to use appropriate proportions, so that one unit of price corresponds to one unit of time.

On the MEXC website, you can use a Gann Square through the following steps:
① Go to the spot trading page and select the TradingView version of the K-line chart. (Note: This also works for the futures trading page.)


② On the toolbar on the left, click the [Fibonacci Retracement] button, and then select [Gann Square].


③ From the lowest point of MX price in September, drag forward to start drawing.


④ Click on the Gann Square, click the options button, and then click [Settings]. Here, you can configure the style, coordinates, and visibility settings for the Gann Square.


Please note that currently, Gann Square drawing is not supported on the MEXC App.

Disclaimer: This information does not provide advice on investment, taxation, legal, financial, accounting, or any other related services, nor does it constitute advice to purchase, sell, or hold any assets. MEXC Learn provides information for reference purposes only and does not constitute investment advice. Please ensure you fully understand the risks involved and exercise caution when investing. The platform is not responsible for users' investment decisions.


Oportunidade de mercado
Logo de
Cotação ()
--
----
USD
Gráfico de preço em tempo real de ()

Artigos populares

Ver mais
O que é média de custo em dólar (DCA)? Como funciona o investimento recorrente em Ações dos EUA

O que é média de custo em dólar (DCA)? Como funciona o investimento recorrente em Ações dos EUA

O que é a média de custo em dólar (DCA)? A média de custo em dólar, ou DCA, é uma abordagem de investimento em que a mesma quantia de dinheiro é investida em intervalos regulares, independentemente de
O que é SPOTON? Ação tokenizada da Spotify da Ondo explicada

O que é SPOTON? Ação tokenizada da Spotify da Ondo explicada

Resumo SPOTON é uma ação tokenizada da Ondo projetada para fornecer exposição econômica de retorno total vinculada às ações ordinárias da Spotify Technology S.A., que são negociadas na Bolsa de Valore
Guia de IPO da Kimi: avaliação da Moonshot AI, financiamento, investidores e possível listagem

Guia de IPO da Kimi: avaliação da Moonshot AI, financiamento, investidores e possível listagem

Resumo O interesse em um possível IPO da Kimi aumentou à medida que a Moonshot AI expande seu ecossistema de produtos Kimi, lança modelos de IA mais poderosos e capta bilhões de dólares de investidore

Como Negociar MOONSHOTUSDT na MEXC: Guia de Futuros Pré-IPO da Kimi

Como Negociar MOONSHOTUSDT na MEXC: Guia de Futuros Pré-IPO da Kimi

Resumo A MEXC lançou os Futuros Pré-IPO MOONSHOTUSDT em 6 de agosto de 2026, oferecendo aos traders elegíveis uma forma de assumir posições long ou short alavancadas com base nas expectativas do merca

Artigos relacionados

Ver mais
Domine as tendências do mercado com indicadores de negociação cripto

Domine as tendências do mercado com indicadores de negociação cripto

Na negociação de criptomoedas, a análise de indicadores técnicos refere-se a um método quantitativo que utiliza fórmulas matemáticas e estatísticas para avaliar as tendências do mercado. Ao processar
Como usar o TradingView na MEXC

Como usar o TradingView na MEXC

O TradingView é uma ferramenta poderosa de análise de negociação que atende a usuários de todos os níveis de experiência. A MEXC integrou as ferramentas de gráficos do TradingView, permitindo que você
O que é o Indicador Estocástico (KDJ)?

O que é o Indicador Estocástico (KDJ)?

O Indicador Estocástico (KDJ) é uma ferramenta de análise técnica que avalia tendências de preço para medir a força do mercado e identificar condições de sobrecompra e sobrevenda, auxiliando os trader

O que é SAR Parabólico?

O que é SAR Parabólico?

O SAR Parabólico (Stop and Reverse) é uma ferramenta de análise técnica amplamente utilizada para determinar a direção das tendências de preço e identificar possíveis pontos de reversão. Esse indicado

Cadastre-se na MEXC
Cadastre-se e receba até 10.000 USDT em bônus

Junte-se à comunidade da MEXC

Receba em tempo real as listagens mais recentes, eventos e atualizações diretamente do nosso canal oficial no Telegram.

Mais de 25,000 membros

Futuros

BTC/USDT
ETH/USDT
GOLD(XAU)/USDT