

How to Use On-Balance Volume in Trading: A Complete Beginner's Guide
Key Takeaways:
- The On-Balance Volume indicator is a momentum-based technical indicator introduced by Joe Granville in 1963. It uses cumulative changes in trading volume to help anticipate price movements.
- OBV is based on the principle that volume precedes price, allowing traders to identify potential trend changes before they appear in price action.
- OBV can be interpreted in three main ways: trend confirmation, divergence signals, and breakout validation.
- Three practical OBV strategies include divergence reversals, moving average confirmation, and accumulation detection during consolidation.
- Users can add OBV to the candlestick chart on MEXC and combine it with other tools for more comprehensive analysis.
1. What Is On-Balance Volume?
On-Balance Volume, or OBV, is an indicator used to measure buying and selling pressure in the market. It was introduced by financial analyst Joe Granville in his 1963 book, Granville's New Key to Stock Market Profits, and was one of the earliest technical tools designed to track positive and negative volume flow.
The central principle behind OBV is that volume precedes price. Granville believed that trading volume is a major force driving financial markets and that changes in volume often appear before corresponding changes in price when large investors begin entering or exiting the market. By observing the direction of OBV, traders may identify potential trend changes earlier.
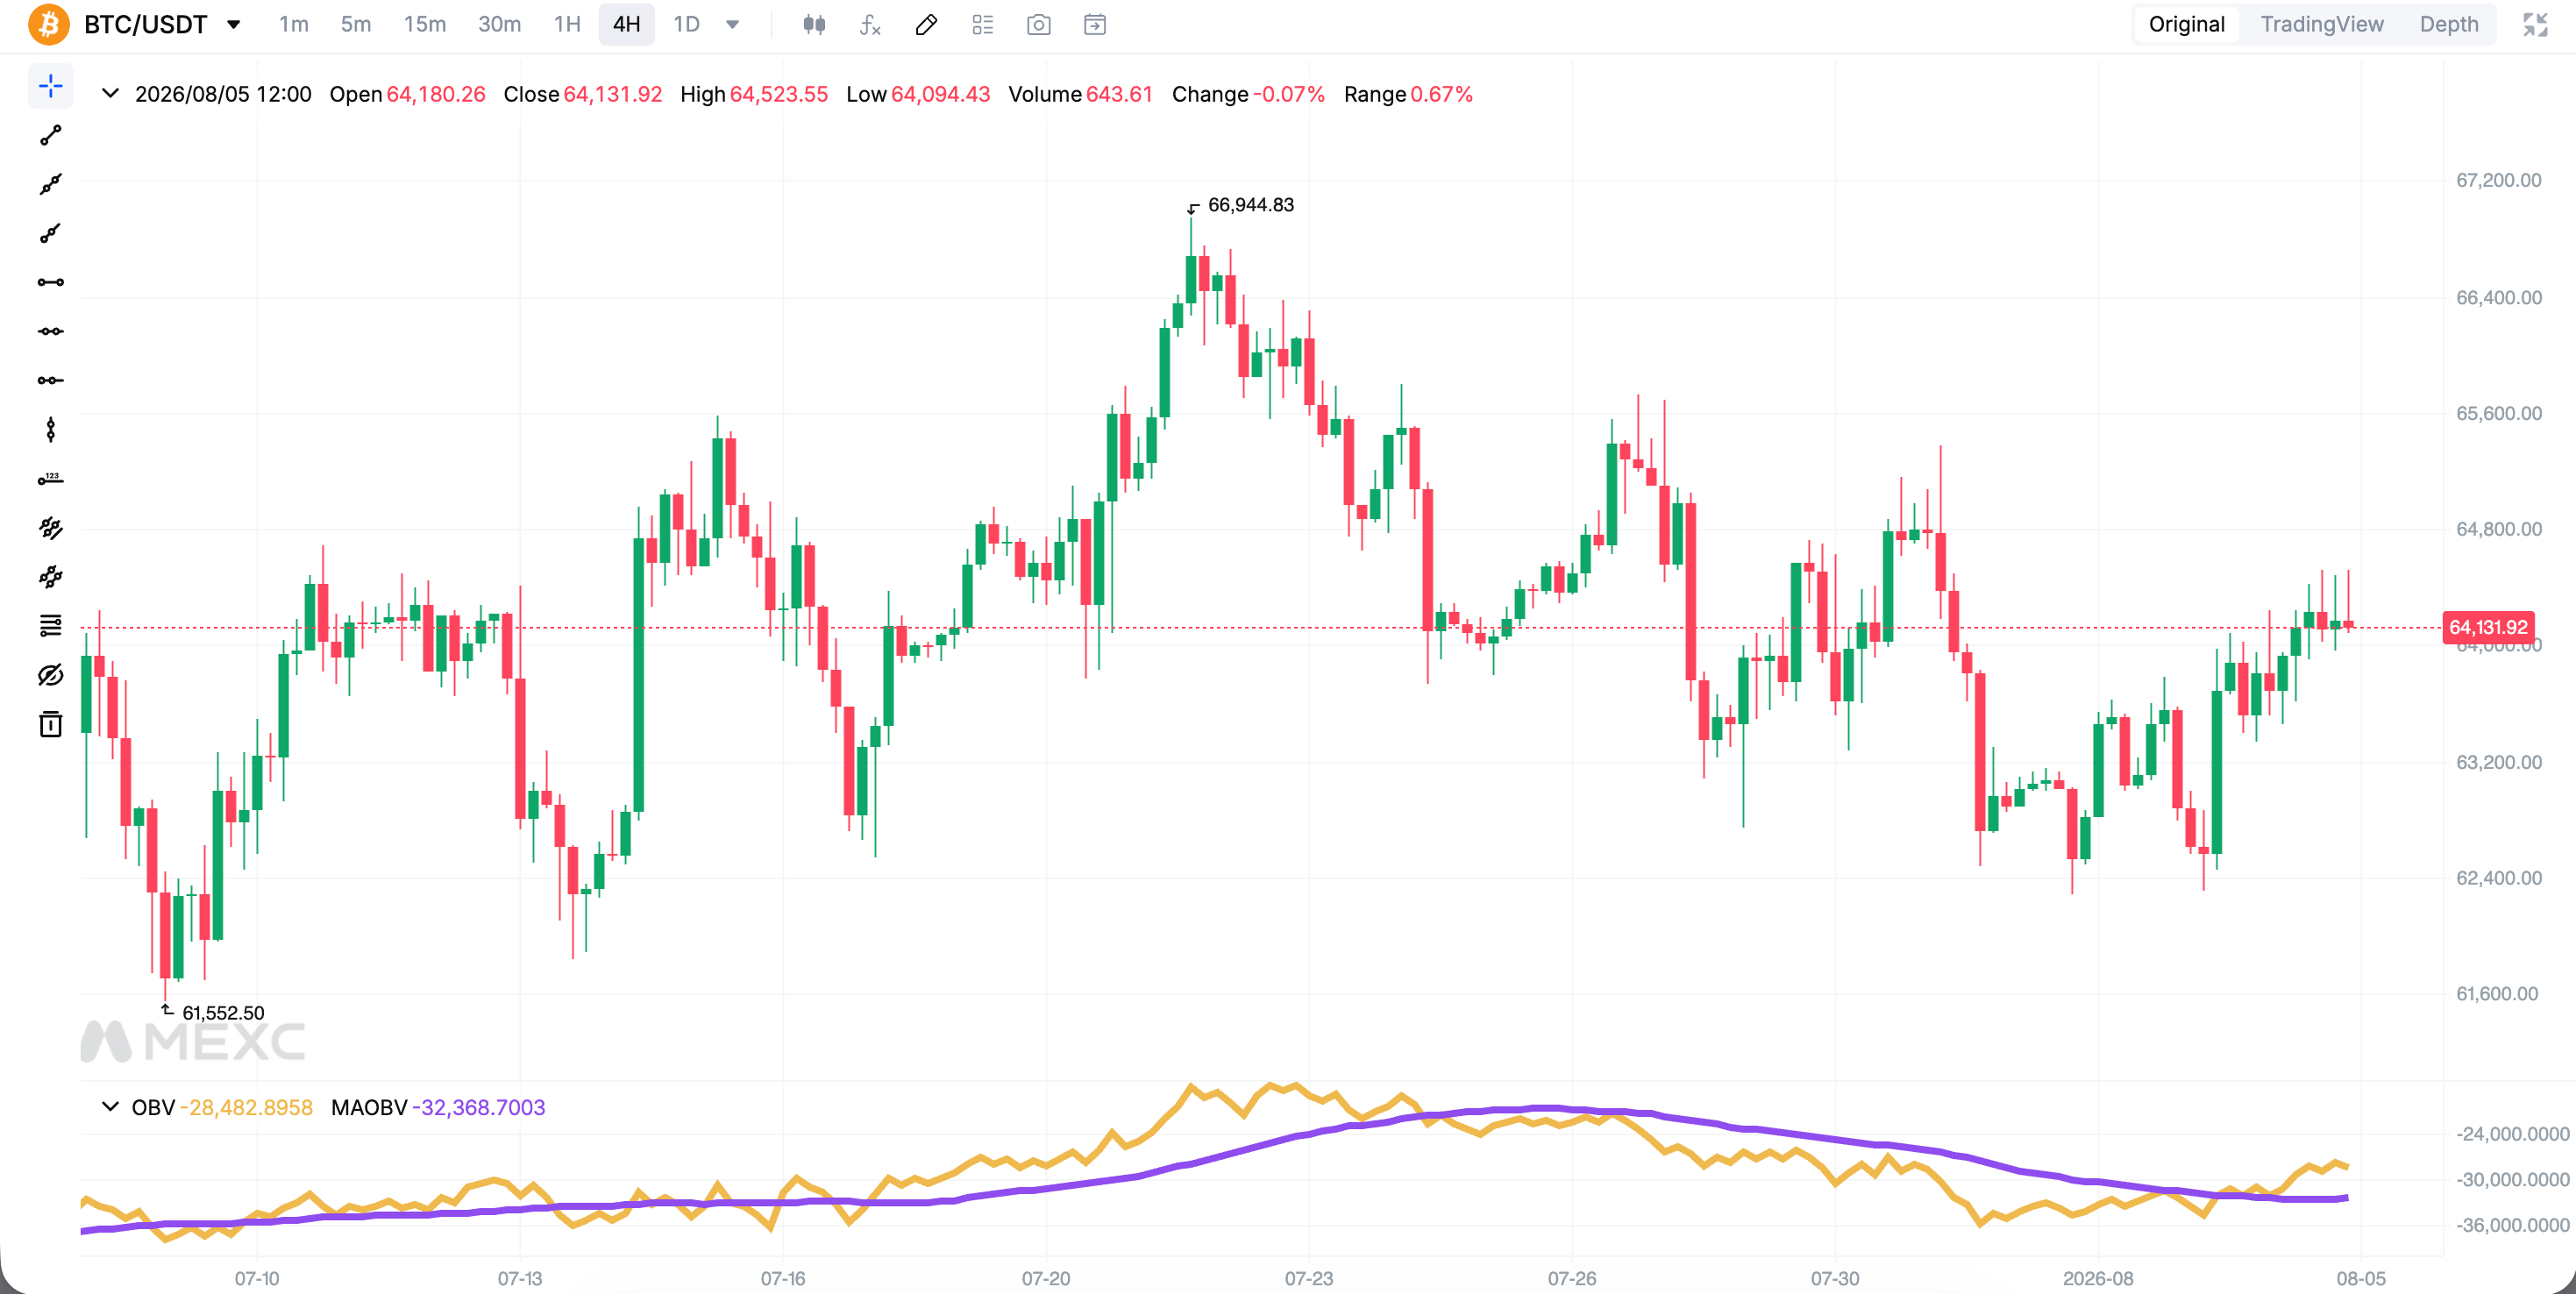
2. How to Interpret On-Balance Volume
2.1 Trend Confirmation
The most basic use of OBV is to confirm the strength of an existing trend. When the price forms higher highs and OBV also rises, the uptrend is supported by genuine buying pressure and may be more likely to continue. Conversely, when both the price and OBV move lower, OBV confirms the strength of the downtrend.
2.2 Divergence Signals
Divergence is one of the most important OBV signals. It occurs when the price and the indicator move in different directions:
Bullish divergence: The price forms a lower low while OBV forms a higher low. This suggests that selling pressure is weakening even though the price continues to decline, potentially signaling an upward reversal.
Bearish divergence: The price forms a higher high while OBV forms a lower high. This indicates that buying pressure may be weakening and that the uptrend could lose momentum or reverse.
2.3 Breakout Validation
When the price breaks through a key support or resistance level, traders can use OBV to assess the strength of the breakout. If OBV simultaneously breaks above a previous high or below a previous low, the price breakout may be more credible. If OBV fails to confirm the move, the breakout may lack conviction, and traders should proceed cautiously.
3. On-Balance Volume Trading Strategies
3.1 Classic Divergence Reversal Strategy
Mark significant price highs and lows together with the corresponding swing points on OBV. When a clear divergence appears, wait for confirmation from the price structure before entering a trade. Confirmation may include a break above a recent swing high or below a recent swing low. A stop-loss order can be placed beyond the nearest local high or low.
3.2 Combining OBV With a Moving Average
Combining OBV with a moving average can help filter out false signals. When OBV is above its moving average and both are trending upward, traders may prioritize long setups. When OBV is below its moving average and both are trending downward, traders may prioritize short setups. This combination can improve signal quality.
3.3 Identifying Accumulation During Consolidation
When the price remains within a narrow consolidation range while OBV continues to rise, it may indicate that large investors are accumulating positions. Traders may consider entering after the price makes a confirmed breakout above the upper boundary of the range.
Before applying these strategies with real funds on MEXC, beginners should test them with small positions and use multiple technical indicators for confirmation.
4. Advantages and Limitations of On-Balance Volume
Advantages: OBV is simple to calculate and interpret. It provides several types of signals, including trend confirmation, divergence, and breakout validation. It also has relatively little lag, may occasionally act as a leading indicator, and does not repaint historical signals.
Limitations: Sudden volume spikes caused by breaking news may distort the indicator and generate false signals. Price noise on shorter timeframes may reduce signal reliability. OBV does not account for the magnitude of price changes and may be less effective in sideways or range-bound markets.
Professional traders commonly recommend using OBV on timeframes of 15 minutes or longer and combining it with other tools, such as the Relative Strength Index and moving averages. Traders should not rely on OBV alone when making trading decisions.
5. How to Use On-Balance Volume on MEXC
1)Add OBV to the candlestick chart on MEXC and begin with major digital assets that have relatively high liquidity.
2)Start with longer timeframes, such as the four-hour or daily chart, and learn to identify trend confirmation and divergence signals.
3)Establish clear entry, stop-loss, and take-profit rules instead of trading based on intuition.
4)Apply appropriate risk management and confirm every OBV signal with other technical tools.
Go to MEXC Website → Spot/Futures → Indicators → OBV
6. On-Balance Volume FAQ
6.1 What is the on-balance volume indicator?
OBV measures buying and selling pressure by adding trading volume when the price rises and subtracting it when the price falls. Traders use its direction to help anticipate potential price movements.
6.2 How do you use OBV in trading?
OBV has three primary uses: comparing its direction with the price to confirm a trend, identifying divergence between the price and OBV to anticipate possible reversals, and using OBV to validate breakouts of key price levels.
6.3 What is the difference between OBV and trading volume?
Standard trading volume shows the level of trading activity during each period. OBV accumulates volume based on whether the price rises or falls, helping traders assess the broader direction of buying and selling pressure.
6.4 Is OBV suitable for day trading?
OBV can be used for day trading. However, shorter timeframes contain more market noise and may produce more false signals. Day traders may consider using timeframes of 15 minutes or longer and combining OBV with other indicators to filter signals.
6.5 What is OBV divergence?
OBV divergence occurs when the price and the indicator move in different directions. A lower low in price accompanied by a higher low in OBV is bullish divergence and may signal a rebound. A higher high in price accompanied by a lower high in OBV is bearish divergence and may signal a pullback.
6.6 Can OBV be used as a standalone trading signal?
It is not recommended. OBV signals should be confirmed with other technical analysis tools. Traders can combine OBV with price structure, moving averages, and other indicators to improve the reliability of their decisions.
Recommended Reading:
Risk Disclaimer: Technical indicators are calculated using historical data and are provided for reference only. They cannot guarantee future market performance. Digital asset markets are highly volatile, and trading involves risk. Make decisions carefully based on your own risk tolerance and avoid following market trends blindly.