

XRP Falls Below $1.50 for First Time Since November 2024 as Open Interest Declines and Bears Remain in Control

- XRP drops below $1.50, trading at $1.35 for the first time since November 2024.
- Declining open interest and bearish momentum keep selling pressure high.
Ripple’s XRP extended its decline this week with the price slipped below the $1.50 level for the first time since November 2024 as broader crypto markets came under pressure. Right now, XRP is trading $1.36 (continuously down), with a 24-hour drop of about 15% and a 24-hour range between roughly $1.35 and $1.60. The extended downtrend has erased around 43% from XRP’s monthly high above $2.3.
One notable factor behind the continued weakness is a significant reduction in leveraged positions within the XRP derivatives market. Open interest has fallen sharply from around $1.25 billion just one week ago to about $996.5 million currently, signaling a substantial unwinding of speculative exposure.
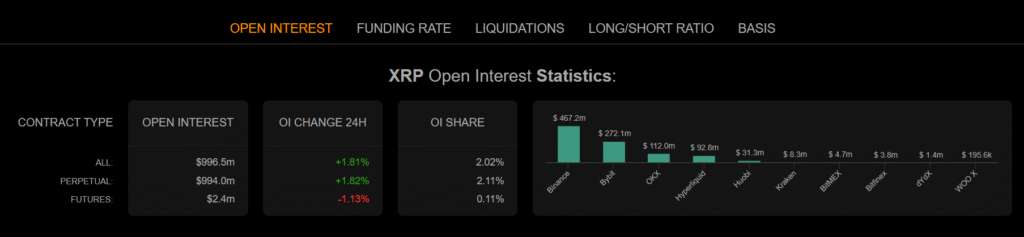 (Source: Coinalyze)
Perpetual contracts make up the bulk of this open interest at roughly $994 million, while futures contracts hold a small fraction near $2.4 million. Leading exchanges such as Binance and Bybit dominate trading activity, accounting for the largest shares of open interest with approximately $467 million and $272 million respectively..
Still, the main driver of XRP’s drop today is broader crypto market selling pressure. Major cryptocurrencies such as Bitcoin and Ether have declined, dragging altcoins lower in correlation with wider risk sentiment. Traders faced liquidations and profit-taking, particularly among leveraged long positions, which accelerated the decline across digital markets.
Falling Channel Structure Keeps XRP Under Pressure
On technical charts, XRP observed a falling channel, where the price struggled to hold the midline and experienced a rejection that confirmed sellers remain in control. Lower wicks at recent lows hint that selling pressure may be slowing around the $1.40 demand zone, but there is no evidence of a confirmed reversal.
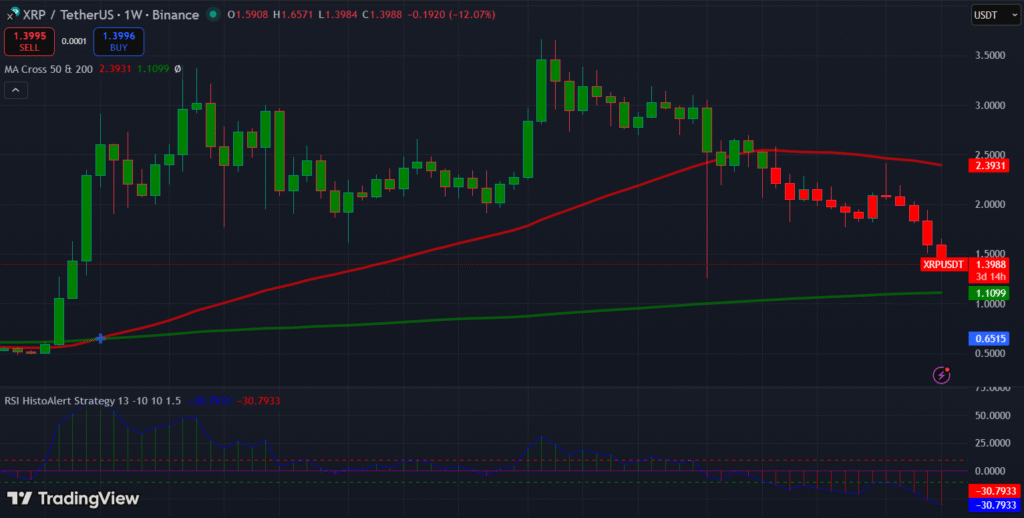
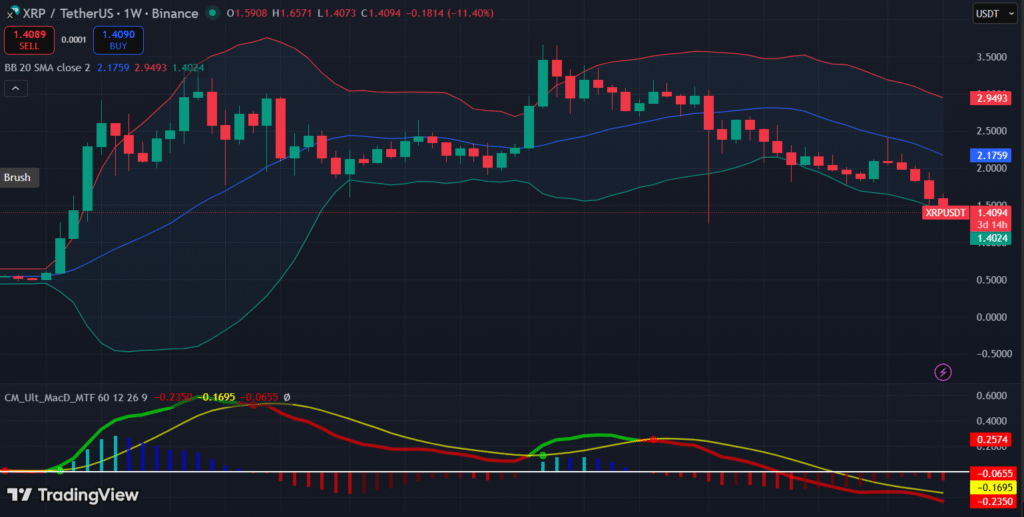
So, XRP’s recent price action shows strong bearish signals. XRP has fallen below the $1.50 support zone, slipping to around $1.35 in the latest sessions. On the weekly point, XRP is trading below its 20-week simple moving average near $2.17, as well as below the medium-term 50-week moving average around $2.39, affirming a loss of trend support. Also, the Bollinger Bands show prices hugging the lower band, indicating rising volatility and the dominance of sellers.
 (Source: TradingView)
Zooming in the momentum indicators also remain bearish, with the MACD histogram consistently negative and both MACD lines below zero, underscoring downward pressure. Prices have drifted toward a longer-term demand area near the current level, but no reversal signal has emerged yet on weekly time frames.
 (Source: TradingView)
Meanwhile, the RSI has dropped into oversold territory, currently near -30.79, which historically suggests extreme bearish sentiment but has not yet triggered a clear reversal signal. This aligns with the absence of bullish divergence and continued pressure from sellers, emphasizing that downside momentum may persist in the near term.
As long as prices remain below the broken former support around $1.60–$1.80, any bounce risks being corrective rather than trend-changing. The 200-week moving average near roughly $1.10 represents the next meaningful longer-term support if the current demand zone fails to hold. A clean weekly reclaim of resistance above $1.80–$2.00 would be required before technical sentiment shifts toward stabilization.
Ayrıca Şunları da Beğenebilirsiniz

ZEC Technical Analysis Feb 5

White House launches direct to consumer drug site
