

Cardano crypto (ADA) compressed and oversold at a decision point around $0.27


While the broader market attempts a cautious rebound, Cardano crypto sits right on a pivotal technical level that will soon force a clearer direction.
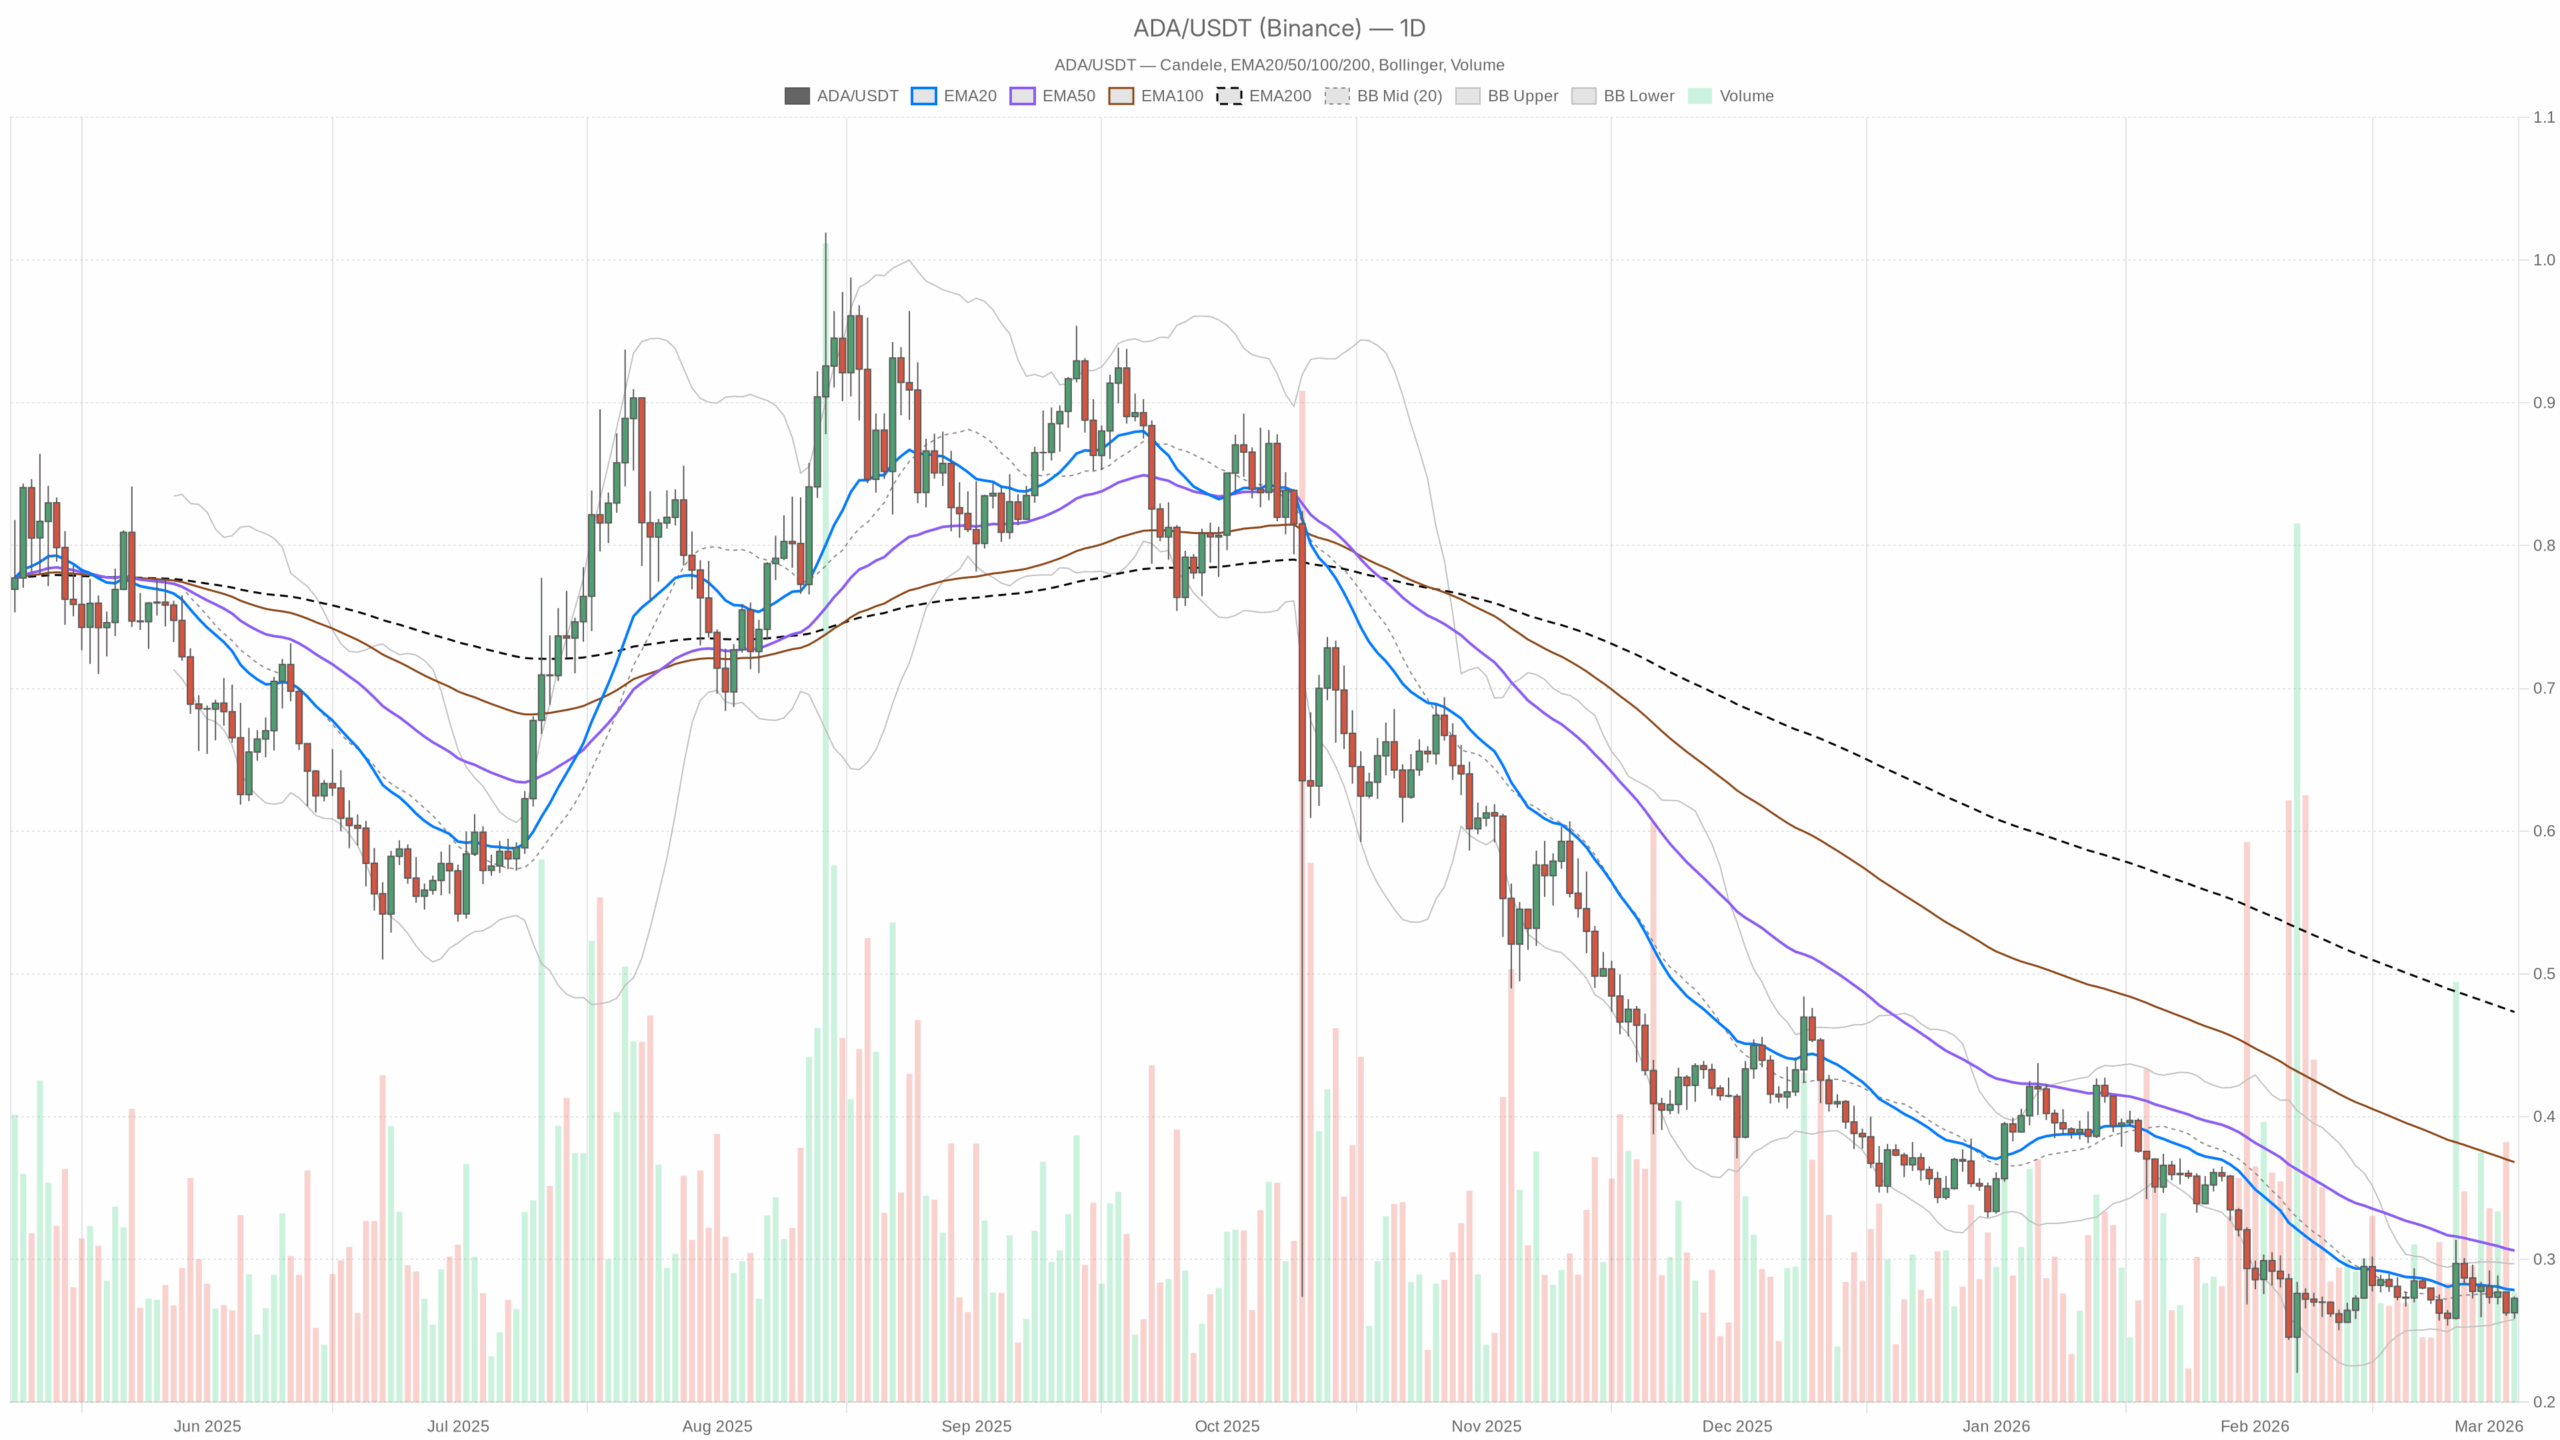 ADA/USDT — daily chart with candlesticks, EMA20/EMA50 and volume.
Daily Bias: Bearish with Early Mean-Reversion Potential
The main scenario, based on the daily timeframe, is still bearish. ADA is trading beneath the 20, 50, and 200-day EMAs, with the system labelling the regime as bearish. That keeps the primary bias down until proven otherwise. However, momentum is no longer washed out, and volatility is low enough to allow for a sharp squeeze if the market gets even a small catalyst.
Daily Timeframe (D1): Structure Still Down, but Pressure Easing
Price & Trend Context
– Close: $0.27
– Regime: Bearish (system classification)
ADA is effectively pinned at the daily pivot PP = $0.27, stuck in the lower half of a much larger downtrend channel. Price is below all key moving averages, confirming the longer-term weakness, but not in full-on capitulation. It looks more like a slow bleed that is starting to base.
EMAs (20 / 50 / 200)
– EMA 20: $0.28
– EMA 50: $0.31
– EMA 200: $0.47
Price below the 20, 50, and 200-day EMAs confirms a layered downtrend. The 20-day is only 1 cent above spot, so short-term trend is weak but not aggressively rejecting price. The 50-day and 200-day are much higher, reflecting the broader structural damage from previous selloffs. For bulls, the first real battle line is reclaiming and holding above the 20-day EMA. Until that happens, every bounce is suspect and can get faded.
RSI (Daily)
– RSI 14: 45.9
Daily RSI is below 50 but far from oversold. That fits a controlled downtrend rather than panic selling. It tells you sellers are still in charge on higher timeframes, but they are not pressing as hard as before. There is room for RSI to push up toward 50–55 without changing the bigger picture, which supports the idea of a short-term bounce inside a broader bearish regime.
MACD (Daily)
– MACD line: -0.01
– Signal: -0.01
– Histogram: ~0
Daily MACD is essentially flat at slightly negative values. Momentum to the downside has cooled off; you are not seeing strong downside acceleration, but you are also not seeing a convincing bullish cross with follow-through. It is classic indecision at the lows: trend is still pointed down, but with enough exhaustion that a bounce is plausible if buyers step in.
Bollinger Bands (Daily)
– Middle band (≈ 20D MA): $0.28
– Upper band: $0.30
– Lower band: $0.26
– Price: $0.27 (between mid and lower band)
ADA is trading between the middle and lower Bollinger Bands, close to the lower half of the volatility envelope. That aligns with a downtrend that is losing force: price is not hugging the lower band in crash mode, but it is still weighed down. Also, the band width is relatively tight, which usually precedes a volatility expansion. Given the larger bearish backdrop, that expansion can go either way. However, the first quick move is often a sharp mean-reversion pop toward the mid or upper band before the market decides on a larger directional trend.
ATR (Daily)
– ATR 14: $0.02
An average daily range of about 2 cents at a 27-cent price tag is moderate. It means ADA is not in a high-volatility blow-off or capitulation phase at the moment. For traders, it translates into contained but real risk: a normal day can easily swing 7–8% in either direction from current levels.
Pivot Levels (Daily)
– Pivot Point (PP): $0.27
– Resistance 1 (R1): $0.28
– Support 1 (S1): $0.26
Price sitting exactly on the daily pivot says the market is undecided at this level. A sustained push above $0.28 would put ADA back over the pivot and closer to the 20-day EMA, giving bulls a short-term foothold. A break and close below $0.26 would flip the map. It would signal a new leg down within the existing bearish trend, likely attracting fresh short interest or capitulating late longs.
1-Hour Timeframe (H1): Short-Term Buyers Stepping In
Price & Regime
– Close: $0.27
– Regime: Neutral
On the 1H chart, ADA has shifted into a neutral intraday regime. That is a meaningful contrast with the bearish daily structure and is exactly the kind of early signal you see before a relief rally, if it can stick.
EMAs (1H)
– EMA 20: $0.27
– EMA 50: $0.27
– EMA 200: $0.27
All three intraday EMAs are essentially stacked on top of each other at the current price. This is a compressed equilibrium zone: it tells you the market has digested the last move and is coiling. When EMAs flatten and cluster like this, the next move tends to be impulsive. Combined with the daily downtrend, this is a classic coiled spring against the larger trend situation.
RSI (1H)
– RSI 14: 65.1
On the 1H, RSI is in bullish territory, leaning into overbought. Short-term buyers have clearly taken control after a prior dip. However, because this is happening below the daily moving averages, you should read it as a counter-trend rally rather than a confirmed trend change. It supports the idea of a push toward resistance, but also warns that chasing late can lead to getting caught at the local top.
MACD (1H)
– MACD line: ≈0
– Signal: ≈0
– Histogram: ≈0
Intraday MACD sits flat near the zero line. Momentum has already fired off its strongest burst and is now pausing. This aligns with the EMAs: the market is trying to decide whether this short-term strength becomes a genuine intraday uptrend or just rolls over back into the higher-timeframe bearish structure.
Bollinger Bands (1H)
– Middle band: $0.26
– Upper band: $0.27
– Lower band: $0.26
– Price: $0.27 (near the upper band)
On 1H, ADA is pinned near the upper Bollinger Band, with bands themselves relatively tight. That is short-term upside pressure inside low volatility. Often, you will see a quick overshoot or a fake break above the band followed by a snap back to the mean. It argues for caution on fresh longs at these intraday levels unless you are targeting quick scalps.
ATR (1H)
– ATR 14: ≈0
The 1H ATR printing effectively zero in the data indicates very low realized intraday volatility at the moment. The market is in a quiet consolidation phase. This is the calm before a move, with direction still undecided.
Pivot Levels (1H)
– Pivot Point (PP): $0.27
– R1: $0.27
– S1: $0.27
The hourly pivot set tightly around $0.27 with almost no differentiation between support and resistance is another reflection of price compression. On this timeframe, the market is effectively saying there is nothing to see yet and that traders should wait for a break.
15-Minute Timeframe (M15): Overbought for Execution, Not for Bias
EMAs (15m)
– Close: $0.27
– EMA 20: $0.27
– EMA 50: $0.26
– EMA 200: $0.27
On the 15m, ADA trades around the 20 and 200 EMAs with the 50 EMA still slightly below. That is a short-term bullish tilt on a micro timeframe: price has lifted enough to pull the fast average up, while the slower trend metrics are still catching up.
RSI (15m)
– RSI 14: 74.6
RSI on the 15-minute is firmly in overbought territory. This does not mean price must collapse, but it does say the immediate thrust has been strong and could be due for a pause or pullback. For execution, that favors buying dips rather than chasing breakouts on this timeframe.
MACD (15m)
– MACD line: ≈0
– Signal: ≈0
– Histogram: ≈0
Like the 1H, 15m MACD is flat around zero. The momentum burst that pushed RSI into overbought has already happened, and the market is in a wait-and-see mode. Price is vulnerable to a fast shakeout in either direction if liquidity is thin.
Bollinger Bands & ATR (15m)
– Middle band: $0.26
– Upper band: $0.27
– Lower band: $0.26
– ATR 14: ≈0
Price hugging the upper band in a very tight-band environment with almost no recorded ATR reflects a micro squeeze. On a 15m basis, you are late to the move if you are entering now. It is more a place to manage existing risk than to initiate large fresh positions.
DeFi & On-Chain Context: Cardano-Specific Activity Cooling
On Cardano’s DeFi side, DEX fee data from Minswap, WingRiders, SundaeSwap, and other protocols shows sharp 30-day drops in fees, with many platforms down 50–70% month-on-month, even though some have seen a modest rebound over the last 7 days. That reflects lower on-chain activity and trading interest on Cardano’s DeFi stack, which tends to cap organic demand for ADA itself.
In other words, fundamentals are not providing a strong tailwind here. Any bounce in ADA is more likely to be driven by broader market risk-on behavior or short-covering rather than a sudden surge in Cardano-specific usage, at least in the very short term.
Market Environment: Fearful but Not Collapsing
With global crypto market cap around $2.49 trillion and up about 5.4% in 24 hours, the broader market is attempting a rebound. Yet the fear & greed index at 10 (Extreme Fear) shows sentiment is still heavily risk-off. BTC dominance near 57% confirms that capital is clustering in Bitcoin, leaving altcoins like Cardano under-owned and vulnerable but also potentially primed for snap-back rallies if sentiment improves even slightly.
Scenarios for Cardano Crypto (ADA)
Bullish Scenario
In the bullish path, the intraday strength on 1H and 15m evolves into a proper mean-reversion bounce against the daily downtrend. Price holds the daily pivot and S1 area between $0.26–0.27, using it as a base. RSI on 1H stays above 50, and the compressed EMAs on that timeframe start to turn up, with price establishing a series of higher lows.
A confirmed bullish shift would look like:
- Clean break and daily close above $0.28, near R1 and the 20-day EMA region.
- Daily RSI pushing back above 50.
- 1H MACD crossing and holding above zero with an expanding histogram.
Under that setup, ADA can feasibly target the $0.30–0.31 area, where the upper Bollinger Band on D1 and the 50-day EMA converge. That is the natural first magnet for a counter-trend rally. Beyond that, any attempt toward the mid-$0.30s would require broader market risk-on plus improving DeFi activity. Right now, that is an extension, not the base case.
What invalidates the bullish scenario?
A decisive breakdown below $0.26 on strong volume, especially if accompanied by daily RSI rolling back toward 40 and 1H RSI losing the 50 level. That would signal the bounce attempt has failed and the market is handing control back to sellers.
Bearish Scenario
The bearish path leans on the dominant daily trend. Here, $0.27–0.28 proves to be nothing more than a lower high in a continuing downtrend. Intraday overbought signals, with RSI around 65–75 on 1H and 15m, resolve downward, with price rejected from around the 20-day EMA region and failing to reclaim $0.28.
If ADA closes back under the pivot and especially under $0.26 (S1), the path opens up for another leg down. Given the current ATR, a fresh move lower could quickly revisit prior support zones a few cents below, effectively another 7–10% drop without much structural effort.
In that case, you would expect:
- Daily RSI drifting toward or below 40.
- Daily MACD turning more negative with a widening histogram.
- H1 EMAs rolling over again with price clearly below the 20 and 50 EMAs.
What invalidates the bearish scenario?
Sustained trade above $0.30–0.31 with a daily close that recaptures the 50-day EMA would seriously challenge the idea that this is just another lower high. At that point, the bearish narrative on the daily chart would be under pressure, and you would have to start entertaining the possibility of a medium-term base.
How to Think About Positioning and Risk
Cardano crypto right now is a bearish higher timeframe story with a coiled short-term structure. That mix usually leads to one of two outcomes: a sharp, tradable bounce that ultimately gets sold, or a clean continuation lower that punishes anyone trying to front-run the reversal.
Volatility, as measured by ATR, is moderate on the daily, nearly absent intraday, and the Bollinger Bands are tight across timeframes. These conditions tend to precede a breakout in either direction. Meanwhile, sentiment remains extremely fearful, which historically has been a fertile environment for short, violent squeezes but not necessarily sustained uptrends.
In practical terms, this is not a spot to be casual with risk sizing. Both bullish and bearish scenarios require clear levels: roughly $0.26 as the immediate downside line in the sand and $0.28–0.31 as the upside decision zone. Until one side wins that battle, ADA is stuck between a structurally bearish backdrop and an increasingly tense short-term coil.
For traders, the edge comes from respecting those levels, acknowledging the uncertainty, and treating any move out of this compression as a potential fast move, not a slow grind. Cardano remains quiet now, but quiet in this kind of market rarely lasts.
Ayrıca Şunları da Beğenebilirsiniz

Kraken Financial Secures Federal Reserve Master Account in Historic First for U.S. Crypto Banking

CEO Sandeep Nailwal Shared Highlights About RWA on Polygon
