

XRP (XRP) Price Analysis: Chart Pattern Hints at Potential 50% Surge Ahead

Key Highlights
- XRP currently trades in the $1.36–$1.39 range with critical support established at $1.33
- Technical analysis reveals a symmetrical triangle formation with a potential target of $2.06
- Investment products linked to XRP experienced $30 million in capital flight during the previous week
- XRPL stablecoin reserves climbed 2.5% in seven days, reaching $426 million
- Critical resistance zones identified at $1.42, with additional barriers at $1.53 and $1.75–$1.80
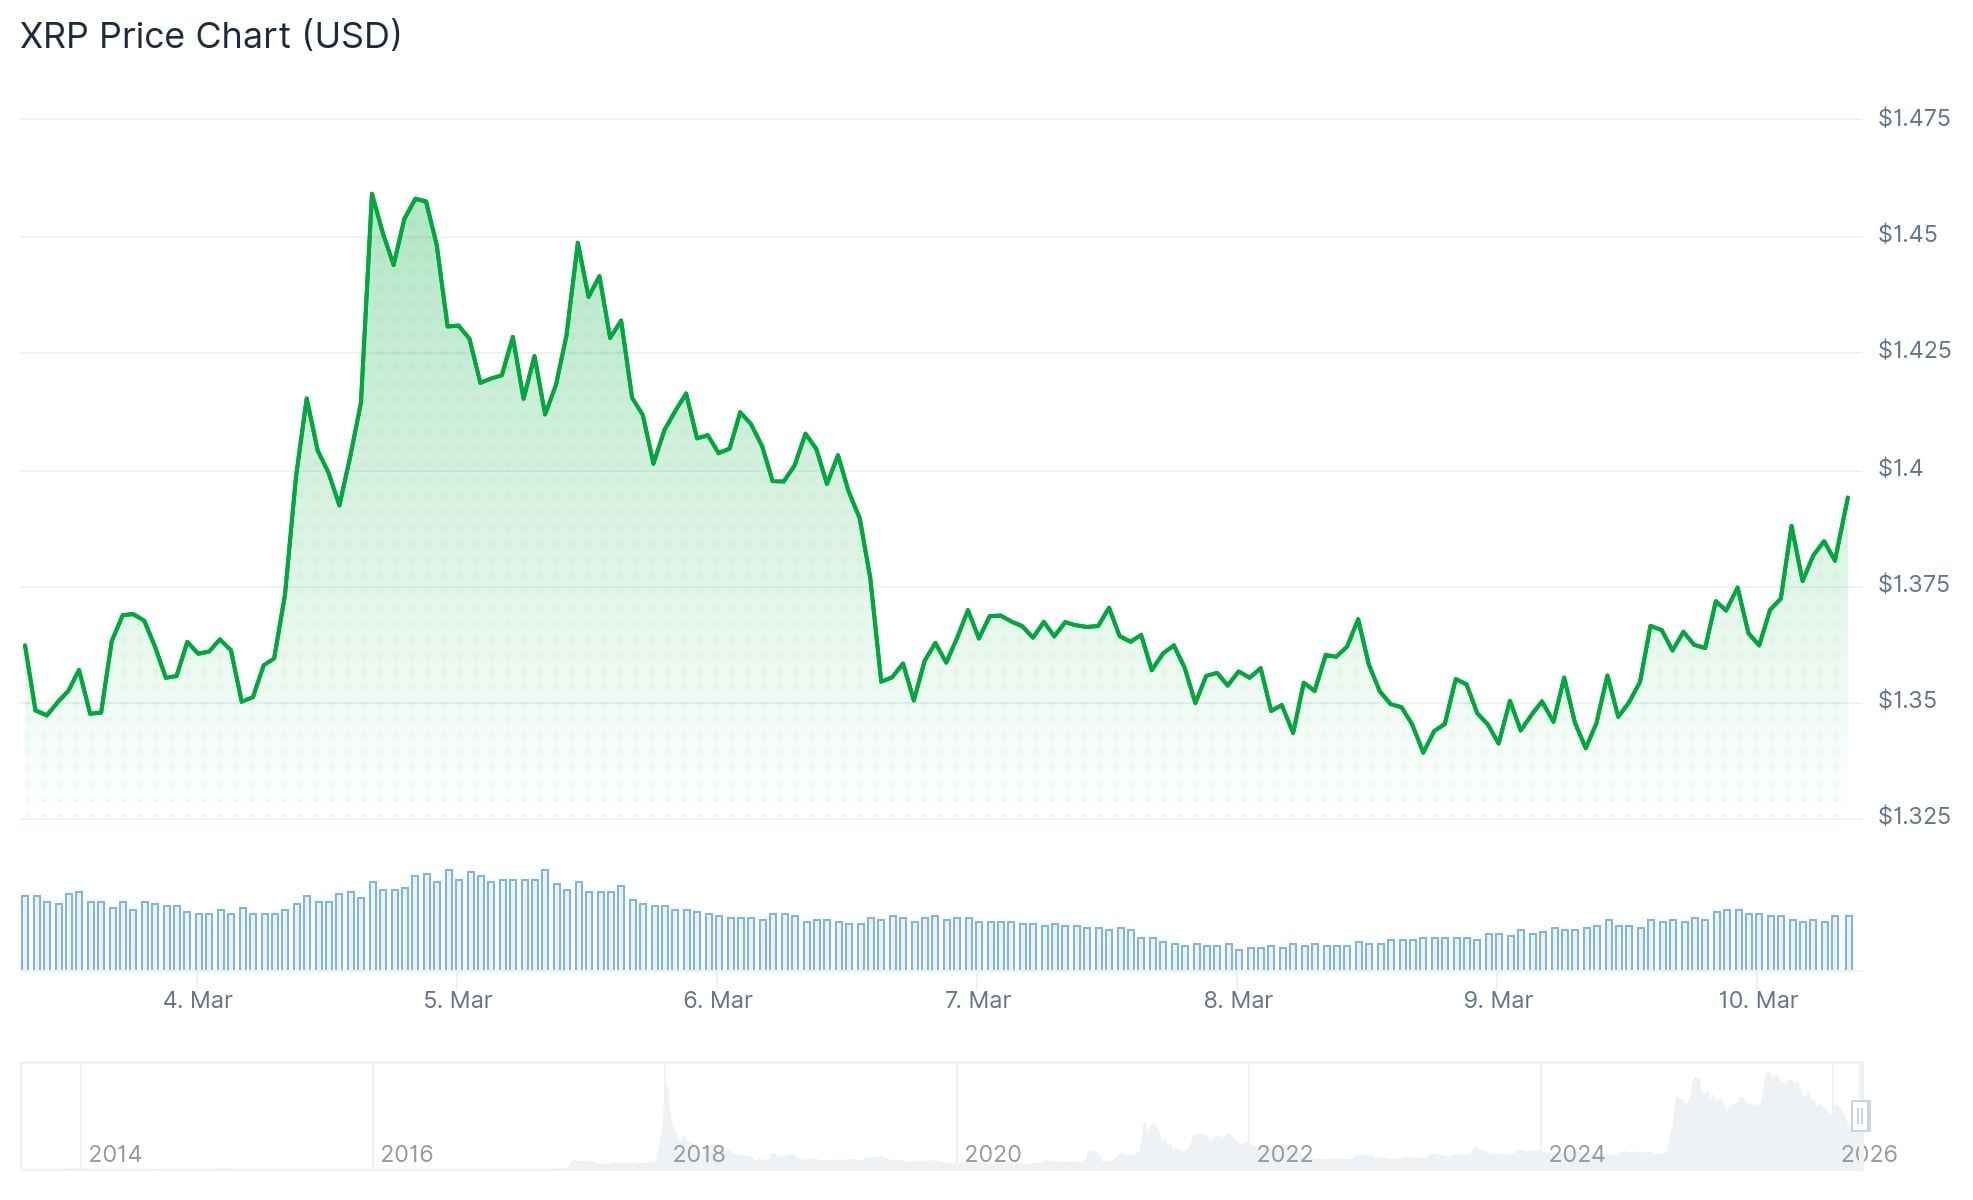
XRP is currently positioned around $1.37 as of March 10, 2026, showing resilience after dipping to $1.34 earlier in the session. The digital asset experienced an approximately 8% decline from its weekly peak of $1.46 before staging a recovery.
 XRP Price
The pullback coincided with broader market weakness as Bitcoin faced headwinds from inflation data and escalating Middle Eastern geopolitical tensions. During Asian market hours on March 10, XRP demonstrated strength with a nearly 4% advance, briefly touching $1.39.
Since reaching its all-time high of $3.66 in July, XRP has entered a corrective pattern marked by successively lower peaks and troughs on weekly timeframes. This structure reflects ongoing short-term bearish momentum.
However, the declining size of recent candlesticks indicates the market may be entering a consolidation phase rather than continuing its downtrend.
Triangle Formation Emerges on Daily Timeframe
Technical analysts have identified a symmetrical triangle developing on XRP’s daily chart. This classic pattern features converging trendlines that connect successive highs and lows as price volatility contracts.
A decisive move above the upper boundary would signal bullish continuation. Market observers are particularly focused on the 23.6% Fibonacci retracement at $1.42 as the initial hurdle that must be overcome.
Should XRP successfully breach the $1.42 level, the technical measurement derived from the triangle projects a price objective around $2.06. This represents approximately a 50% upside from current levels.
Momentum indicators support the bullish case, with the MACD showing upward trajectory while the RSI displays positive divergence against recent price movement. These signals suggest diminishing bearish pressure.
Market analyst JD highlighted on March 9 that XRP continues to respect a long-established ascending trendline dating back to early accumulation phases below $0.01. Historical data shows consistent buying interest whenever prices test this support.
The $3.30–$3.50 zone represents a formidable resistance area for any sustained rally. Technical interpretations of this region vary between an ascending triangle top or rising wedge formation.
Capital Flows and Network Metrics
According to CoinShares data, XRP-focused investment vehicles registered $30 million in withdrawals during the past week. Despite recent outflows, total assets under management remain substantial at approximately $2.4 billion, with year-to-date inflows still positive at $123 million.
Spot XRP exchange-traded funds in the United States recorded $22 million in net redemptions over the last fortnight, breaking a four-week streak of positive flows.
Futures market positioning shows Open Interest at $2.25 billion, representing a significant contraction from the July high of $10.94 billion.
Conversely, on-chain data from DeFiLlama reveals stablecoin reserves on the XRP Ledger expanded 2.5% during the previous seven days to reach $426 million. Rising stablecoin balances generally indicate enhanced liquidity and increased transactional activity within the ecosystem.
Near-term support remains anchored at $1.33, with a breach potentially exposing $1.27. On the topside, traders are monitoring resistance at $1.42, $1.53, and the $1.75–$1.80 band.
The post XRP (XRP) Price Analysis: Chart Pattern Hints at Potential 50% Surge Ahead appeared first on Blockonomi.
Ayrıca Şunları da Beğenebilirsiniz

Winklevoss Brothers’ $130M Bitcoin Move Sparks Market Scrutiny and Strategic Speculation

YouTube Surpasses Disney as World’s Largest Media Giant With $62.3B Revenue
