Gold Price Stalls Near $5,000 as Oil Surge Creates Critical Market Pressure

BitcoinWorld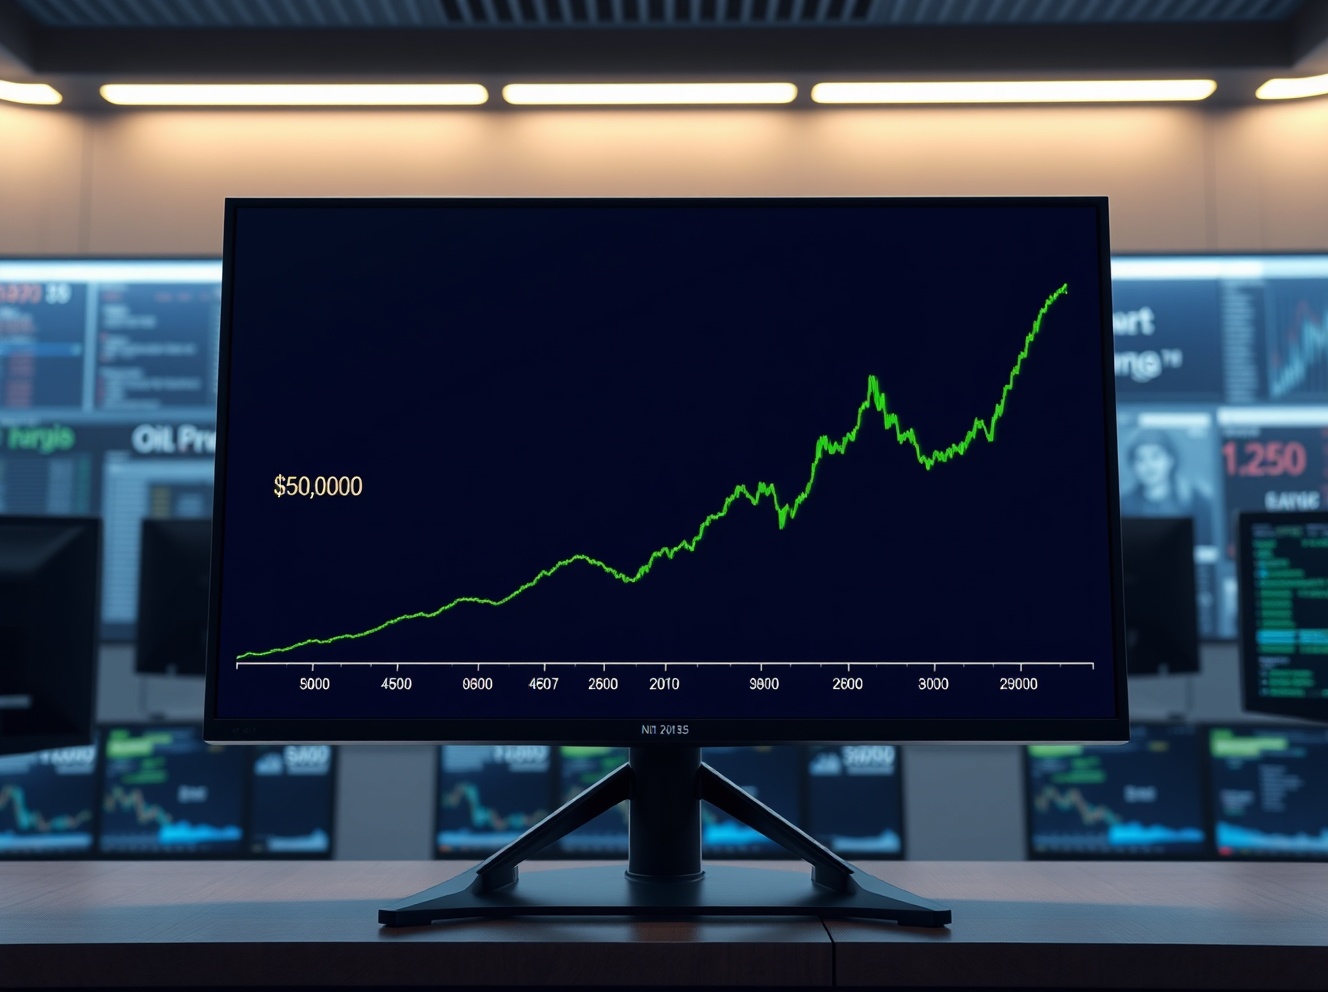
Gold Price Stalls Near $5,000 as Oil Surge Creates Critical Market Pressure
Global commodity markets face a pivotal moment in early 2025 as the gold price struggles to maintain momentum above the psychologically significant $5,000 per ounce level. Concurrently, a powerful surge in crude oil prices applies substantial upward pressure on inflation expectations, effectively capping gold’s traditional role as a safe-haven asset. This complex dynamic, visible across major financial charts, reflects a fundamental clash between monetary metals and energy inputs within the global economy.
Gold Price Analysis and the $5,000 Threshold
Market analysts closely monitor the gold price as it consolidates near the $5,000 mark. This level represents a major technical and psychological barrier for traders and long-term investors. Historical data shows that such round-number thresholds often act as strong resistance points before a potential breakout or reversal. The current price action indicates significant selling pressure whenever gold approaches this zone. Furthermore, trading volumes have increased during these tests, suggesting heightened institutional interest. Several factors contribute to this struggle, including shifting central bank policies and currency fluctuations. The relative strength of the U.S. dollar, for instance, traditionally exerts inverse pressure on dollar-denominated gold. Market participants now weigh these technical signals against broader macroeconomic trends.
Technical Chart Patterns and Key Levels
Examining the daily and weekly charts reveals specific patterns. The 50-day and 200-day moving averages provide critical dynamic support and resistance levels. A consolidation pattern, often resembling a symmetrical triangle, has formed over recent weeks. This pattern typically precedes a volatile price movement. Key support currently resides near the $4,850 level, while resistance firmly holds at $5,050. A decisive close above $5,100 could signal a new bullish phase. Conversely, a break below $4,800 might trigger a deeper correction. These technical indicators provide a framework for understanding short-term price behavior.
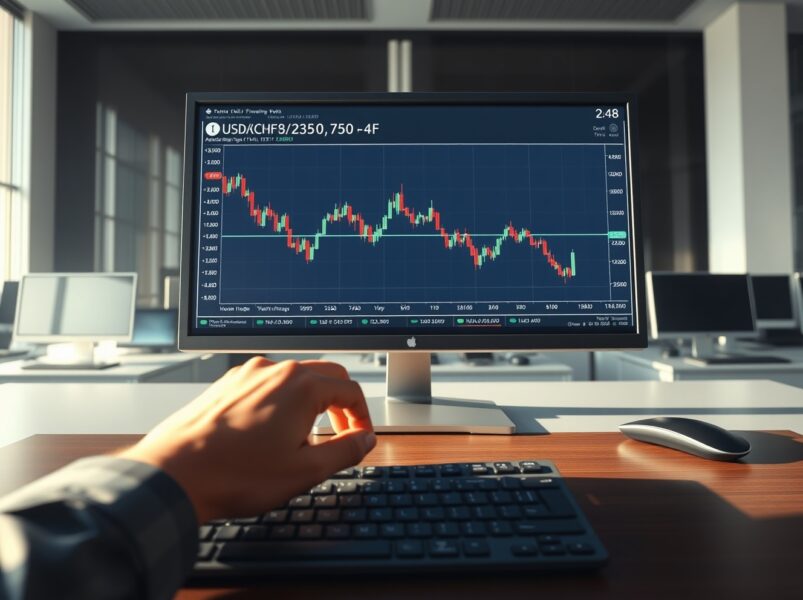
The Surging Oil Market and Its Macroeconomic Impact
Meanwhile, Brent and West Texas Intermediate crude oil benchmarks continue a sharp upward trajectory. Supply constraints, geopolitical tensions in key producing regions, and robust global demand collectively fuel this rally. The oil price surge directly impacts consumer and producer inflation indices. Central banks worldwide monitor these developments closely, as energy costs filter through entire economic systems. Higher oil prices increase transportation and manufacturing expenses. Consequently, businesses often pass these costs to consumers, creating sustained inflationary pressures. This environment challenges the traditional monetary policy toolkit.
Primary drivers of the current oil rally include:
- OPEC+ production discipline and extended supply cuts
- Geopolitical instability affecting major export routes
- Stronger-than-expected economic growth in emerging markets
- Limited investment in new fossil fuel exploration over previous years
The Inflation Hedge Paradox: Gold Versus Oil
Historically, investors purchased gold as a primary hedge against inflation. The current market presents a paradox. Rising oil prices stoke inflation fears, which should theoretically support gold. However, the mechanism is more nuanced. Aggressive oil-driven inflation often forces central banks to maintain or even raise interest rates to cool the economy. Higher real interest rates increase the opportunity cost of holding non-yielding assets like gold. Therefore, the oil surge creates a dual effect: it generates inflationary pressure while simultaneously prompting monetary responses that can dampen gold’s appeal. This tension is clearly visible in the correlated yet divergent paths of the two commodities on price charts.
Expert Analysis on Intermarket Dynamics
Financial strategists emphasize the importance of analyzing these commodities together. “The relationship between gold and oil is not linear,” notes Dr. Anya Sharma, Chief Commodity Strategist at Global Markets Insight. “While both are inflation-sensitive, their drivers differ. Oil is a consumption commodity tied to real economic activity. Gold is a monetary asset tied to real interest rates and currency values. The current surge in oil is so potent it’s altering the calculus for all assets, including gold, by forcing a reevaluation of the global interest rate trajectory.” This expert perspective underscores the complex feedback loop between energy markets and financial assets.
Historical Context and Comparative Performance
Reviewing past decades provides valuable context. The gold-to-oil ratio, which measures how many barrels of oil one ounce of gold can buy, has experienced significant volatility. Periods where oil strongly outperforms gold, like the present, often coincide with specific economic phases. These phases typically involve supply-driven energy shocks and proactive central bank tightening. The following table illustrates key historical periods of oil outperformance and the subsequent impact on gold.
| Period | Oil Price Change | Gold Price Change | Primary Market Driver |
|---|---|---|---|
| 1979-1980 | +150% | +35% | Iranian Revolution, Volcker Rate Hikes |
| 1999-2000 | +110% | -5% | Dot-com Boom, Strong USD |
| 2007-2008 | +105% | +25% | Global Growth, Pre-Financial Crisis |
| 2021-2022 | +80% | -10% | Post-Pandemic Demand, Fed Pivot |
| 2024-2025* | +65% (YTD) | +8% (YTD) | Geopolitical Supply Shock, Sticky Inflation |
*Data through Q1 2025. Source: Composite data from World Bank, Bloomberg Terminal.
Future Outlook and Market Implications
The immediate future for the gold price depends heavily on the duration and magnitude of the oil price surge. If oil stabilizes at a high plateau, inflation expectations may become entrenched, potentially renewing gold’s appeal as a long-term store of value. However, if oil prices continue to climb sharply, forcing more aggressive central bank action, gold could face further headwinds. Market participants also watch for potential demand destruction in oil, which could alleviate some pressure. Additionally, any escalation or de-escalation of geopolitical conflicts will directly influence both markets. Portfolio managers are increasingly adjusting their commodity allocations to account for this new correlation regime.
Conclusion
The struggle for the gold price near $5,000 amidst a powerful oil surge defines a critical juncture for commodity markets in 2025. This scenario highlights the intricate balance between inflation hedges and the monetary policy responses they provoke. While charts show gold’s upside currently capped, the fundamental drivers of long-term demand—including central bank buying and geopolitical uncertainty—remain intact. The evolving relationship between these two benchmark commodities will provide crucial signals about the health of the global economy and the trajectory of inflation for the remainder of the decade. Investors must therefore analyze both gold and oil prices in tandem to navigate this complex landscape effectively.
FAQs
Q1: Why is the $5,000 level so important for gold?
The $5,000 per ounce mark is a major psychological and technical resistance level. A sustained break above it could signal a new long-term bullish trend, attracting more institutional investment. It represents a doubling from the previous major high around $2,500, making it a significant milestone.
Q2: How do rising oil prices directly affect gold?
Rising oil prices increase inflation expectations, which is typically positive for gold. However, they also force central banks to consider higher interest rates to combat that inflation. Higher rates increase the opportunity cost of holding gold, which pays no yield, creating a negative pressure that can offset the positive inflation hedge effect.
Q3: What is the gold-to-oil ratio, and what does it indicate now?
The gold-to-oil ratio measures how many barrels of oil one ounce of gold can buy. A low ratio, as seen currently, indicates oil is expensive relative to gold. Historically, extremely low ratios have sometimes preceded mean reversion, where gold’s performance improves relative to oil.
Q4: Are central banks still buying gold despite this price pressure?
Yes, according to recent reports from the World Gold Council, central bank demand for gold remains a structural support for the market. Diversification away from the U.S. dollar and a desire for a neutral reserve asset continue to drive official sector purchases, providing a demand floor.
Q5: Could another asset benefit from this gold-oil dynamic?
Some analysts suggest commodities linked to the energy transition, like copper and silver, may see relative strength. Copper acts as both an industrial metal and a partial inflation hedge, while silver has monetary and industrial uses. Their performance may decouple from the direct gold-oil tension.
This post Gold Price Stalls Near $5,000 as Oil Surge Creates Critical Market Pressure first appeared on BitcoinWorld.
Ayrıca Şunları da Beğenebilirsiniz

CME Group to Launch Solana and XRP Futures Options
USD/CHF Forecast: US Dollar Plummets Toward 0.7850 as Fed Decision Looms