

IntroductionAXT Inc. (NASDAQ: AXTI) has become one of the most talked-about names in the semiconductor materials space in 2026, and traders searching for AXTI stock analysis, AXTI price prediction, anIntroductionAXT Inc. (NASDAQ: AXTI) has become one of the most talked-about names in the semiconductor materials space in 2026, and traders searching for AXTI stock analysis, AXTI price prediction, an
AXT Inc. (NASDAQ: AXTI) Stock Technical Analysis 2026: Chart Patterns, Price Trends, and Trading Outlook for AI-Driven Semiconductor Growth

作者:MEXC
分享
Introduction
AXT Inc. (NASDAQ: AXTI) has become one of the most talked-about names in the semiconductor materials space in 2026, and traders searching for AXTI stock analysis, AXTI price prediction, and AXT Inc technical analysis are watching the chart closely after an explosive rally. The company, which designs, develops, and manufactures compound and single-element semiconductor substrates, has ridden a powerful wave of demand for indium phosphide materials used in AI data center optical networking. This technical analysis breaks down the AXTI stock chart, key support and resistance levels, candlestick patterns, and moving average signals to help traders and investors understand where the stock may be headed next.
This article focuses purely on price action and chart-based technical analysis rather than fundamental valuation, using real daily closing price, volume, RSI, and MACD data from the past 50 trading sessions. We will look at trend structure, momentum indicators, moving averages, and the volume behavior that has defined AXTI's move from a small-cap laggard to one of NASDAQ's standout AI infrastructure plays this year.
Key Highlights
- AXTI stock closed at $88.58, up 17.84% in a single session, following a blowout Q2 2026 earnings beat.
- Shares are up roughly 49% over the past month and have gained more than 4,500% over the past year, reflecting an extraordinary long-term uptrend.
- AXTI staged a V-shaped reversal, rallying more than 139% in six trading sessions off a July 29 closing low of $36.97, after falling roughly 71% from its late-May high near $129.35.
- The 14-day RSI recovered from a deeply oversold 30.93 on July 29 to 64.89 as of August 7, confirming strong renewed momentum without yet reaching overbought territory.
- The MACD indicator completed a bullish crossover, with the MACD line moving to +1.10 against a signal line of -4.36, producing the largest positive histogram reading of the past 50 trading sessions.
- Price is trading roughly 47% above its 10-day moving average ($60.13) and 59% above its 20-day moving average ($55.63), an unusually wide extension that raises the odds of near-term consolidation.
- Volume on the latest session came in near 19 million shares, about 67% above the 20-day average of 11.4 million shares, confirming genuine participation behind the move.
- Analyst sentiment remains bullish, with an average 12-month price target of $91.60 and a range between $55.00 and $125.00.
AXTI Stock Price Action: A Technical Overview
The AXTI stock chart tells a story of dramatic transformation. After years of trading as a largely overlooked small-cap semiconductor substrate maker, AXT Inc. shares spent much of the past year building a base before staging a parabolic move higher. On the one-year chart, the stock advanced from near single-digit levels to a recent close of $88.58, an increase of more than 4,500%, driven largely by its exposure to indium phosphide substrates used in AI and data center optical transceivers.
Zooming into daily price data over the past 50 trading sessions gives a much sharper technical picture. AXTI actually peaked near $129.35 in late May, then entered a steady corrective decline that bottomed at a closing low of $36.97 on July 29, a drawdown of roughly 71% from the May high. From that low, the stock staged an extremely sharp V-shaped reversal: it closed at $46.94 on July 30, then $60.43 on July 31, before accelerating through $65–$75 and finally closing at $88.58 on August 7, a gain of more than 139% in just six trading sessions off the late-July bottom.
This kind of move, a capitulation low followed by an immediate, high-volume reversal, is a classic technical pattern often associated with a 'V-bottom' or exhaustion reversal. The fact that each of the last several sessions closed near its high of the day, rather than fading into the close, is a further sign of persistent buying pressure rather than short-covering that quickly reverses.
AXTI 1-month candlestick chart showing the breakout from a basing pattern. Source: TradingView.
Key Support and Resistance Levels for AXTI
Identifying support and resistance zones is central to any AXTI stock technical analysis, and mapping recent closing swing points gives concrete levels to work with rather than rough estimates. On the downside, the most immediate support sits at $75.17, the August 6 closing level, followed by $68.61–$68.67, which marks a cluster of closes from August 3 and August 5. Below that, $60.43 (the July 31 close) represents a deeper support shelf, and the $50–$53 zone, defined by closes on July 13, July 15, July 22, and July 23, marks the top of the prior consolidation range before the capitulation low.
The single most important support level on the chart remains the $36.97 close from July 29, the recent swing low. As long as price holds above this level on any future pullback, the broader structure since late July stays intact as a higher-low pattern.
On the resistance side, the stock is now pushing back into price territory last visited in mid-June. The $92.44 close from June 22 and the $97–$111 zone from June 1–15 represent the next overhead resistance levels, with the late-May swing high near $129.35 marking the ultimate resistance level from the past 50 trading sessions. Because AXTI gapped and ran so quickly off its July low, there is limited trading history between roughly $89 and $92, which can mean price moves through this zone quickly if buying pressure continues, or stalls if profit-taking emerges at the first sign of resistance.
Moving Averages and Trend Confirmation
Real moving average data confirms the strength of the current move. As of the August 7 close, AXTI's 10-day simple moving average (SMA) stood at $60.13 and its 20-day SMA stood at $55.63, while the stock itself closed at $88.58, meaning price is trading roughly 47% above its 10-day average and 59% above its 20-day average. That is an unusually wide gap, and it reflects just how sharply the stock has accelerated off its late-July low rather than a steady, gradual climb.
The 10-day SMA has also turned decisively higher and is now rising faster than the 20-day SMA, which is the type of short-term bullish crossover technical traders look for following a reversal. At the same time, a gap this wide between price and its short-term averages is often unsustainable in a straight line; historically, stocks that stretch this far above their moving averages tend to either consolidate sideways to let the averages catch up, or pull back toward the 10-day SMA before the next leg higher. Traders should treat the 10-day SMA near $60 and the 20-day SMA near $56 as dynamic support levels to monitor if the rally pauses.
Momentum Indicators: RSI and MACD
The 14-day Relative Strength Index (RSI) for AXTI closed at 64.89 on August 7, up sharply from a reading of just 30.93 on July 29, the day of the swing low. An RSI below 30 typically signals oversold conditions, while a reading above 70 typically signals overbought conditions; at 64.89, AXTI's RSI has recovered firmly into bullish territory but has not yet reached the overbought threshold. This is a genuinely constructive reading: it confirms strong momentum has returned to the stock without yet flashing the kind of extreme overbought warning that often precedes a short-term pullback.
The Moving Average Convergence Divergence (MACD) indicator tells a similar story. The MACD line closed at +1.10 on August 7, crossing above its signal line, which closed at -4.36, for a MACD histogram reading of +5.46, the largest positive reading in the past 50 sessions. This bullish crossover, where the MACD line moves above the signal line after both had been deeply negative during the June-to-July decline, is a classic signal that a new upward momentum phase has begun. Traders watching for confirmation of trend reversals often treat this type of MACD crossover, especially one this pronounced, as validation that the move off the July low is more than a one-day short squeeze.
Volume analysis adds further weight to the bullish case. AXTI's 20-day average daily volume sits at approximately 11.4 million shares, while the August 7 session traded roughly 19 million shares, about 67% above the recent average. A price breakout accompanied by volume this far above trend is generally considered more technically reliable than a move on light volume, since it reflects broad market participation rather than a handful of large trades pushing price around.
Analyst Ratings and Price Target Context
While this is a technical analysis piece, it is useful to frame the chart against prevailing analyst sentiment, since price targets often act as psychological reference points for traders. Coverage on AXTI currently skews heavily toward 'Strong Buy' ratings, with the overwhelming majority of analysts rating the stock a buy or strong buy and none currently recommending a sell.
The average one-year price target sits at $91.60, only modestly above the current price, while the most bullish estimate reaches as high as $125.00 and the most conservative estimate sits near $55.00. That wide dispersion between the high and low targets reflects the difficulty of valuing a stock that has moved this quickly, and it is a useful reminder for traders that sentiment, while currently favorable, can shift rapidly if growth expectations are not met in coming quarters.
Technical Risk Factors to Watch
No uptrend moves in a straight line forever, and the same data that confirms current strength also flags real risk. Price trading roughly 47% above its 10-day SMA and 59% above its 20-day SMA is statistically extended by historical standards for this stock, and mean-reversion toward those averages, currently near $60 and $56, is a realistic scenario even within an intact uptrend. A sharp reversal candle on heavy volume near current levels, sometimes called a bearish engulfing pattern, would be an early technical warning that momentum is fading.
A break back below the $75.17 support level on strong volume would be the first sign of weakening momentum, and a deeper break below $68.61 would open the door to a retracement back toward the $60.43 and $55–$56 zone, where the 20-day moving average currently sits. Only a close back below the $36.97 July swing low would fully invalidate the broader reversal structure.
Traders should also be mindful of the stock's extreme historical volatility. AXTI fell more than 71% from its late-May high to its late-July low, then rallied over 139% in six sessions, illustrating how quickly sentiment and price can swing in both directions. Position sizing and risk management remain essential when trading a stock with this kind of volatility profile, regardless of how constructive current momentum indicators appear.
Conclusion
AXTI stock has transformed from an overlooked small-cap into one of the market's most dynamic AI infrastructure plays, and the underlying technical data currently supports the bullish narrative. The 14-day RSI has recovered from a deeply oversold 30.93 to a healthy 64.89, the MACD has completed a decisive bullish crossover with its largest positive histogram reading of the past 50 sessions, and price is trading well above both its 10-day and 20-day moving averages on volume roughly 67% above trend. Together, these confirm that the reversal off the July 29 low at $36.97 is backed by genuine momentum and participation, not just a short-term squeeze.
At the same time, the magnitude of the move, a gain of more than 139% in six trading sessions, has pushed the stock well beyond its short-term averages, a condition that historically precedes either a consolidation phase or a pullback toward those averages. Traders following AXTI technical analysis should watch the $75.17 and $68.61 levels as the first tests of support, the $55–$60 zone (aligned with the 20-day and 10-day moving averages) as a deeper support area, and the $92–$97 region as the next resistance test on the upside.
Frequently Asked Questions (FAQ)
What is AXT Inc. (AXTI) stock?
AXT Inc. is a NASDAQ-listed semiconductor materials company that designs, develops, and manufactures compound and single-element semiconductor substrates, including gallium arsenide, germanium, and indium phosphide products used in AI data centers, telecommunications, and optical networking.
Why is AXTI stock rising so sharply?
AXTI's rally has been driven primarily by strong demand for its indium phosphide substrates, which are used in high-speed optical components for AI and data center infrastructure, combined with a strong earnings beat and upgraded forward guidance.
What are the key support levels for AXTI stock?
Based on recent closing prices, $75.17 and $68.61 mark the first support levels, with a deeper support zone around $55–$60, aligned with the stock's 10-day and 20-day moving averages, and major support at the July 29 swing low of $36.97.
Is AXTI stock overbought?
As of the most recent close, AXTI's 14-day RSI stands at 64.89, which is in bullish territory but below the traditional overbought threshold of 70. However, price is trading nearly 60% above its 20-day moving average, which is historically stretched and raises the odds of a near-term pause or pullback even if RSI itself is not yet extreme.
What is the AXTI stock price target?
Analyst price targets vary widely, with an average one-year target near $91.60, a high estimate of $125.00, and a low estimate of $55.00, reflecting differing views on how sustainable the current growth trajectory is.
Is AXTI a good stock to buy right now?
This article is for educational and informational purposes only and does not constitute financial advice. Whether AXTI is suitable for any individual depends on personal risk tolerance, investment goals, and further research, and readers should consult a licensed financial advisor before making investment decisions.
Disclaimer
This article is intended for informational and educational purposes only and does not constitute financial, investment, or trading advice. Technical analysis is based on historical price patterns and does not guarantee future performance. Stock prices, especially for high-volatility names like AXTI, can change rapidly and unpredictably. Readers should conduct their own research and consult a licensed financial advisor before making any investment decisions. The author and publisher accept no responsibility for any losses arising from the use of this content.
市场机遇
Gensyn实时价格 (AI)
--
----
USD
Gensyn (AI) 实时价格图表
描述:币圈脉动基于 AI 技术与公开信息,第一时间呈现最热代币趋势。如果想了解更多专业解读与深度分析,请访问新手学院。
本页面分享的文章均源自公开平台,仅供参考。该内容不代表 MEXC 的立场或观点。所有版权归 MEXC 所有。如果您认为任何内容侵犯了第三方的权益,请联系 [email protected] 以便及时删除。 MEXC 不保证任何内容的准确性、完整性或及时性,且不对基于所提供信息而采取的任何行动负责。本内容不构成财务、法律或其他专业建议,亦不应被解释为 MEXC 的推荐或认可。如需专家见解和深入分析,请造访 MEXC 学院。
Gensyn 最新动态
查看更多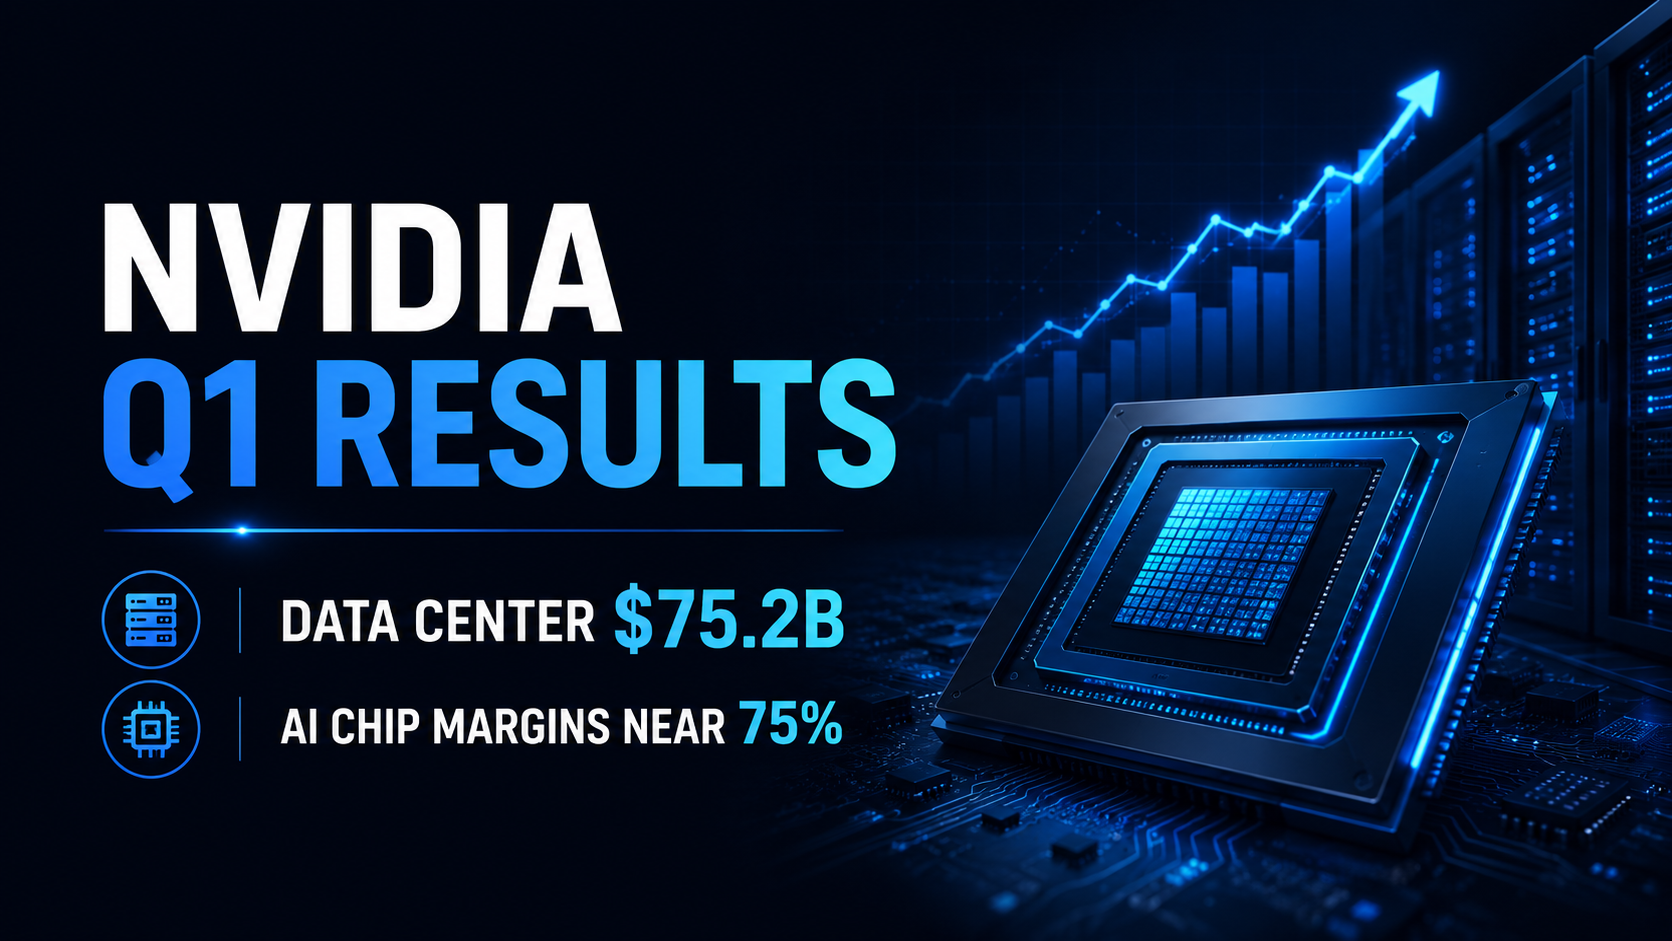
Nvidia FY2027 Q1 财报评析:数据中心营收达 752 亿美元,AI 芯片毛利率稳超 75%
为核心增长引擎的数据中心业务更是一马当先,斩获 752 亿美元营收,较去年同期暴增 92%。尽管面临产能大规模扩张的压力,Nvidia 的定价权依然稳如磐石,GAAP 和非 GAAP 毛利率分别保持在惊人的 74.9% 和 75.0%。
这不仅是一份强劲的财报,更向市场释放了一个清晰的信号:全球对 AI 的强劲需求正以极高的利润率加速转化为真金白银。对于密切关注这一赛道并寻找 Nvidia 最新财报动向的投资者而言,第一季度的强劲表现为接下来的第二季度设定了极高的基准,市场也将继续考验其 AI 基础设施在面对供应链扩产压力及地缘政治溢价时,能否继续保持如此恐怖的扩张步伐。
2026/07/09

苹果 2026 财年第二季度财报回顾:iPhone 营收与服务业务增长维持 EPS 预期
苹果于 2026 年 4 月 30 日发布了 2026 财年第二季度财报,涵盖截至 2026 年 3 月 28 日的季度。总营收达到 1112 亿美元,同比增长 17%,摊薄后每股收益(EPS)增长 22% 至 2.01 美元。苹果表示,该季度创下了公司 3 月份季度的总营收、iPhone 营收和 EPS 纪录,同时服务业务营收也创下历史新高。
这不仅仅是一份常规的硬件周期财报。苹果第二季度的业绩证明,iPhone 需求、服务业务增长以及积极的资本回报计划仍在共同支撑着该公司强大的 EPS 增长故事。对于寻找下一个苹果财报或 AAPL 财报更新的投资者而言,未来的关键问题是,在市场等待更强劲的 AI 和产品周期催化剂之际,苹果能否维持其溢价估值。
2026/07/09

MEXC 链上观察日报:Robinhood Chain单日DEX交易量突破5.6亿美元
2026/07/10
热门
目前热门备受市场关注的加密货币
加密货币价格
按交易量计算交易量最大的加密货币