

What the technicals say about one of the market's hottest AI optical component plays right now Data snapshot as of market close, July 20, 2026. Prices and technical readings are approximate and will mWhat the technicals say about one of the market's hottest AI optical component plays right now Data snapshot as of market close, July 20, 2026. Prices and technical readings are approximate and will m

What the technicals say about one of the market's hottest AI optical component plays right now
Data snapshot as of market close, July 20, 2026. Prices and technical readings are approximate and will move intraday, confirm current levels before trading.
Lumentum has quietly become one of the market's purest ways to play the AI infrastructure buildout. The company makes the optical components, transceivers, and lasers that move data inside and between AI data centers, and demand tied to hyperscaler capacity expansion has turned what used to be a cyclical telecom supplier into a name Wall Street now talks about in the same breath as the AI hardware leaders. That shift has produced a genuinely wild chart, a climb from roughly the double digits a year ago to an all time high above the $1,000 mark earlier this month, followed by a sharp, high volume pullback that has cut the stock by more than a quarter from its peak.
Today shares are changing hands around $765.55, up $32.73, or +4.47%, as buyers step back in after a rough stretch that took the stock down roughly 10.2% over the past month alone. The move follows a fresh Barclays upgrade to Overweight with a $1,000 price target, which briefly sent shares as high as $775.87 intraday, a jump of nearly 5.9%, before the advance settled into today's close. Zoom out and the longer term trend remains extraordinary, this is still a stock up several hundred percent over the past year. Zoom in, and the picture is far more fragile, with today's bounce still needing to prove itself against a month of heavy selling.
Here is what the technical picture is actually saying right now.
📉 Price Action: A Parabolic Run, Then a Violent Reset
LITE is trading at $765.55, up $32.73 (+4.47%) on the day. The one year chart tells a dramatic story, a slow, steady base building phase followed by a nearly vertical acceleration that carried the stock from the low hundreds to above $1,000 in a matter of months, driven by escalating demand for optical transceivers and components used in AI data center buildouts. That parabolic move topped out just above the $1,000 to $1,100 zone earlier this summer, and the stock has been unwinding that spike ever since, falling in a fairly straight line through July before finding buyers this week in the mid $700s.
That decline has been the real story of the past month, not any single day's headline move. This has not been an orderly pullback, it has been a fast, high volume shakeout following a euphoric run, and today's strong green candle on a Barclays upgrade is the market's first real attempt to build a floor after weeks of distribution.
Daily candlestick chart with volume, May to August view. Chart from TradingView.
🧱 Support and Resistance
On the daily chart, LITE's all time high sits in the $1,000 to $1,100 area, reached in the first half of July before sellers took control. From there, price fell in a fairly straight line through the back half of the month, pausing briefly near $950 and again near $850 before ultimately testing the low $700s, with an intraday low print near $676 during the sharpest part of the slide.
Immediate support sits in the $725 to $750 zone, an area that has been tested repeatedly over the past week and has so far held on a closing basis. A clean daily close back below $700 would reopen a retest of the $675 area, the low of the recent shakeout. On the upside, the $800 to $825 zone is the first real resistance shelf, roughly where the stock topped out on its last relief attempt before rolling over again. A sustained close back above $825 would put the stock back in range of the $900 to $950 region and, eventually, a retest of the prior all time high.
One year daily chart, LITE, showing the full run from base to blow-off top and the current pullback. Chart from TradingView.
📊 Key Statistics
Current price | $765.55, +4.47% today |
Past month performance | -$86.97, -10.2% |
Market capitalization | $59.56B |
Price to Earnings (TTM) | 131.07 |
Basic EPS (TTM) | $6.22 |
Revenue (FY) | $1.64B |
Net income (FY) | $25.90M |
Shares float | 75.80M |
Beta (1Y) | 1.06 |
Volume / 30-day average | 4.40M / 5.13M |
The valuation picture reflects a market pricing in a great deal of future growth. A price to earnings ratio above 130 is rich by almost any traditional measure, and it means the stock's technical behavior, not just its fundamentals, is likely to keep driving near term price swings as momentum traders and long term holders pull in different directions.
📊 Technical Ratings: Neutral, With a Bullish Analyst Backdrop
TradingView's Technical Ratings gauge for LITE currently reads Neutral on the 1-day timeframe, with both the oscillators and moving averages components also landing in Neutral territory. That is a notably calmer reading than the price action alone might suggest, today's stock is up 4.47% on the day, yet the indicator summary has not flipped into outright Buy or Strong Buy territory. Zooming out to longer windows tells a more constructive story, the 1-week rating leans toward Buy and the 1-month picture also shows Buy signals building, suggesting the recent stabilization has more conviction behind it on slightly longer timeframes than the daily snapshot alone reveals.
Category | Reading |
Overall Summary (1-day) | Neutral |
Oscillators (RSI, Stoch, MACD, etc.) | Neutral |
Moving Averages | Neutral |
1-week / 1-month trend | Leaning Buy |
Analyst rating (Wall Street consensus) | Strong Buy |
1-year analyst price target | $1,126.41 (+47.14%) |
Current price | $765.55, +4.47% today |
It is worth separating two very different signals here. The technical gauge, built from moving averages and oscillators, is a short term, price driven read that currently sits at Neutral. The analyst rating, by contrast, reflects Wall Street's fundamental view of the business and currently sits at Strong Buy, with a consensus 1-year price target of $1,126.41, implying upside of roughly 47% from current levels. That gap, a Neutral technical picture sitting underneath a Strong Buy fundamental one, is common after a sharp pullback like this. It suggests analysts still like the underlying AI optics growth story even while the chart itself is still repairing the technical damage from the recent slide.
The moving average picture is transitional. Shorter term averages that price broke down through during the July and early August slide are still overhead, while longer term averages remain well below current price given how far the stock ran over the past year. Oscillators cooled off meaningfully during the decline from the highs, and today's rally on an analyst upgrade is an early sign of stabilizing momentum, not yet confirmation of a new uptrend on the daily technical gauge.
Technicals summary and analyst rating gauges, LITE, 1-day timeframe. Data from TradingView.
🔍 Deeper Technical Read
Trend structure.
The longer term uptrend that took LITE from a fraction of its current price to above $1,000 remains intact on a multi month view, even after the sharp reversal. The daily chart, which had been carving a clear pattern of lower highs and lower lows since the summer peak, is now showing its first real attempt at interrupting that pattern with today's advance. One strong session on an upgrade does not undo a month long downtrend, but it is a necessary first step.
Momentum.
Oscillators rolled over hard during the slide from the highs, reflecting genuine selling pressure rather than a shallow, low conviction dip. Today's bounce needs to hold for more than a single session before momentum can be called clearly repaired, and the still cautious summary rating reflects exactly that.
Volume.
Volume has been heavy on the way down, consistent with real distribution during the slide from the highs, and today's move is arriving alongside continued above average turnover near 4.4 million shares against a 30 day average of 5.13 million. Heavy volume on the way down followed by decent volume on the bounce is typical of a stock searching for a new equilibrium after a parabolic move, rather than one settled into a calm, orderly trend.
Moving averages.
With the stock still up sharply on a one year view despite the recent drawdown, longer term moving averages remain upward sloping and sit well below current price. The nearer term averages that price broke down through during the slide are the ones to watch now. Reclaiming them on a closing basis would be a meaningfully more bullish signal than today's bounce alone, and is effectively the technical line in the sand between a completed correction and a lower high inside a larger downtrend.
🧭 Two Scenarios From Here
- Bullish case: Price holds above the $725 to $750 support shelf and pushes through the $800 to $825 resistance zone on continued strong volume, flipping the technical summary decisively toward Buy and opening the door back toward $900 to $950 and eventually a retest of the prior all time high.
- Bearish case: The advance stalls below $800, oscillators roll back toward the lower end of their recent range, and price drifts back down to retest the $700 to $725 support shelf. This is the base case if today's bounce turns out to be a relief rally on an analyst upgrade rather than the start of a fresh leg higher.
🧭 The Bigger Question
The near term setup has improved, with a fresh analyst upgrade and a strong volume driven bounce off support, but the technical picture has not yet swung decisively bullish. LITE remains meaningfully below its all time high from earlier this summer, and the next real test is whether this rally can clear the $800 to $825 resistance shelf with conviction, or whether it fades back into the same volatile range the stock has traded in since its peak.
The longer term question is bigger than any single chart pattern, whether AI driven demand for optical components and transceivers is durable enough to support a stock trading at a price to earnings ratio above 130, or whether the past month's sharp pullback is an early signal that the easiest gains are behind it. That is a story that will keep being written in Lumentum's upcoming fiscal fourth quarter and full year earnings report, scheduled for August 11, 2026 after the market closes, not in a single day's candle.
Off to you: is this the start of a real recovery back toward the highs, or just a bounce inside the same volatile range LITE has traded in since its summer peak?
❓ Frequently Asked Questions
Why did Lumentum stock jump 4.47% today?
Today's move followed a multi week slide from the summer all time high above $1,000, and comes on the back of a fresh upgrade from Barclays to Overweight with a $1,000 price target, which briefly sent shares up nearly 5.9% intraday to $775.87. The move is the kind of pattern technicians look for as an early sign of a selling climax easing, rather than a low conviction, thin volume bounce. One day does not confirm that the slide is over.
Is LITE overbought after such a massive one year run?
Not on the current daily technical picture. Despite the huge one year gain, TradingView's Technical Ratings gauge currently reads Neutral, not Buy or Strong Buy, because the stock has already pulled back sharply from its all time high over the past month. Both the oscillators and moving averages components sit in Neutral territory as well, which is why today's bounce reads as recovering from a cooled off setup rather than piling onto an overbought extreme. The one year return is a separate, longer term fact from what the daily chart is signaling right now.
What do analysts think of Lumentum stock?
Quite a lot, at least on a fundamental basis. The Wall Street consensus analyst rating on LITE currently sits at Strong Buy, with a 1-year consensus price target of $1,126.41, implying upside of roughly 47% from current levels. That is a notably more bullish stance than the Neutral daily technical gauge, and reflects a common pattern after a sharp pullback, analysts remaining constructive on the longer term AI optics growth story even while the short term chart is still working through the damage from the recent slide.
What is the next resistance level for Lumentum stock?
The first shelf sits at $800 to $825, an area where the stock has struggled to hold gains on prior bounce attempts. Above that, $900 to $950 is the next marker, followed by the prior all time high above $1,000. A daily close through $825 on strong volume is the level that would meaningfully change the technical picture toward a more confirmed Buy signal.
What is the key support level to watch?
$725 to $750 is the zone that has held on multiple tests during the recent slide, including today. A daily close below $700 would break that floor and reopen the $675 area, which marked the low of the sharpest part of the recent pullback.
Does Lumentum's next earnings report matter for this chart?
Yes. Lumentum is scheduled to report fiscal fourth quarter and full year 2026 results on August 11, 2026, after market close, followed by a 5 p.m. Eastern webcast. Given how much of the current setup rests on AI driven demand for optical components staying strong, that print is likely to be the next major catalyst, for better or worse, regardless of what the daily chart does between now and then.
Disclaimer: This analysis is for informational and educational purposes only and does not constitute financial, investment, or trading advice. Technical levels and ratings are derived from a snapshot of trading app data and TradingView charts and are approximate, verify current levels on a live chart before making any decisions. Past performance does not guarantee future results.
市场机遇
Gensyn实时价格 (AI)
--
----
USD
Gensyn (AI) 实时价格图表
描述:币圈脉动基于 AI 技术与公开信息,第一时间呈现最热代币趋势。如果想了解更多专业解读与深度分析,请访问新手学院。
本页面分享的文章均源自公开平台,仅供参考。该内容不代表 MEXC 的立场或观点。所有版权归 MEXC 所有。如果您认为任何内容侵犯了第三方的权益,请联系 [email protected] 以便及时删除。 MEXC 不保证任何内容的准确性、完整性或及时性,且不对基于所提供信息而采取的任何行动负责。本内容不构成财务、法律或其他专业建议,亦不应被解释为 MEXC 的推荐或认可。如需专家见解和深入分析,请造访 MEXC 学院。
Gensyn 最新动态
查看更多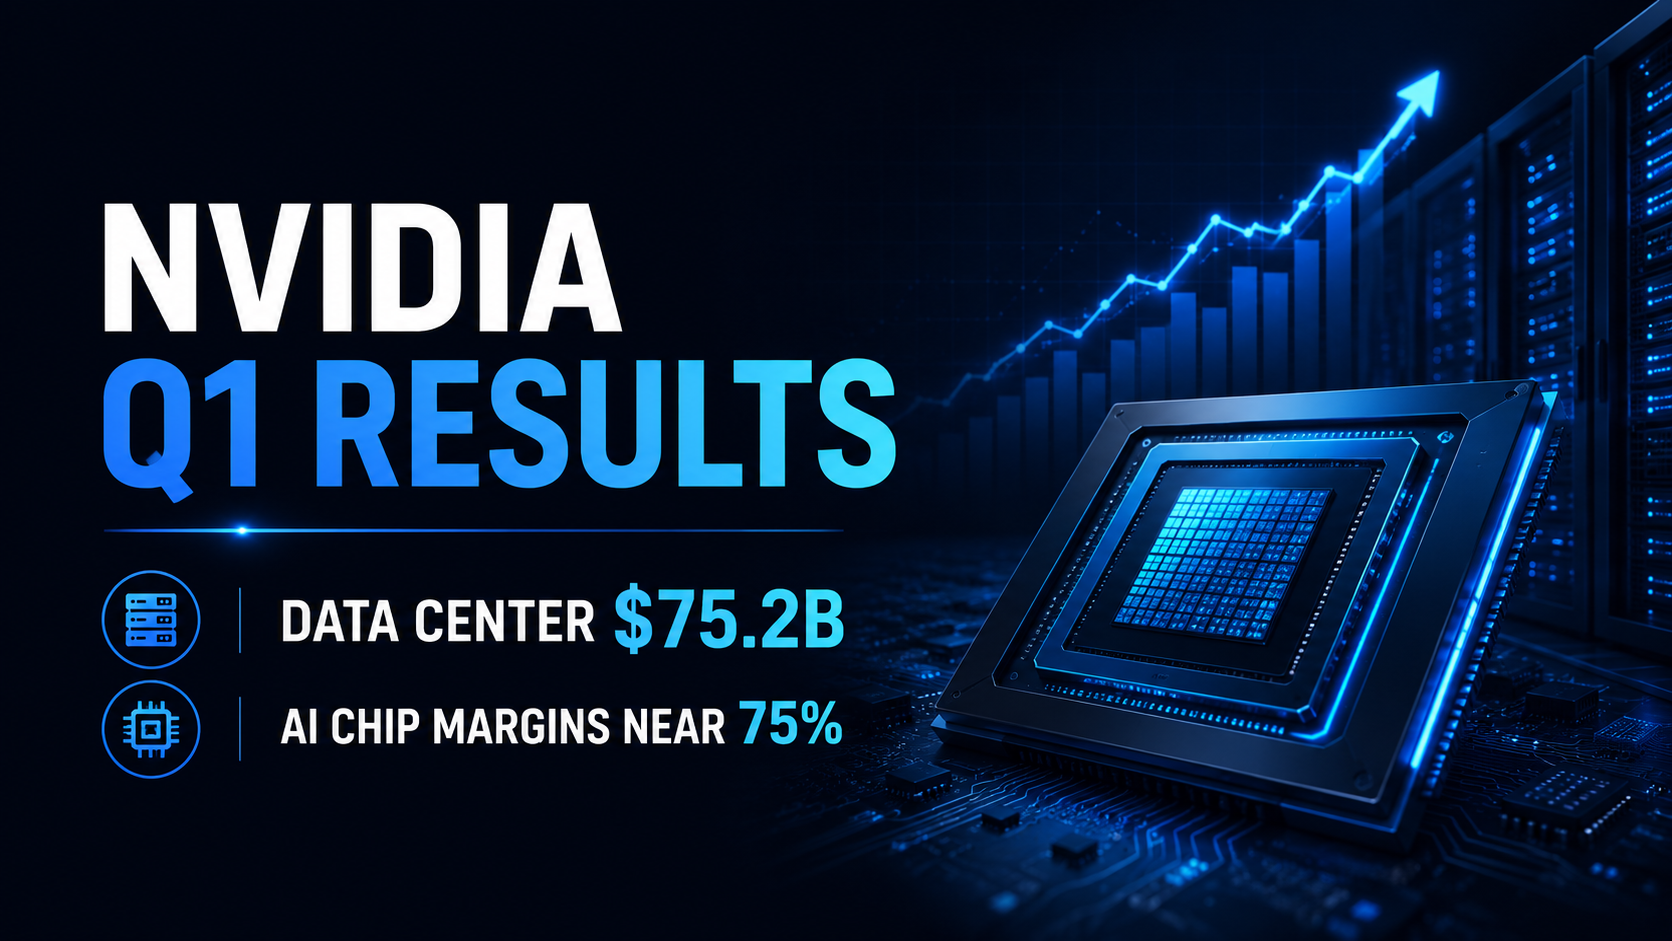
Nvidia FY2027 Q1 财报评析:数据中心营收达 752 亿美元,AI 芯片毛利率稳超 75%
为核心增长引擎的数据中心业务更是一马当先,斩获 752 亿美元营收,较去年同期暴增 92%。尽管面临产能大规模扩张的压力,Nvidia 的定价权依然稳如磐石,GAAP 和非 GAAP 毛利率分别保持在惊人的 74.9% 和 75.0%。
这不仅是一份强劲的财报,更向市场释放了一个清晰的信号:全球对 AI 的强劲需求正以极高的利润率加速转化为真金白银。对于密切关注这一赛道并寻找 Nvidia 最新财报动向的投资者而言,第一季度的强劲表现为接下来的第二季度设定了极高的基准,市场也将继续考验其 AI 基础设施在面对供应链扩产压力及地缘政治溢价时,能否继续保持如此恐怖的扩张步伐。
2026/07/09

苹果 2026 财年第二季度财报回顾:iPhone 营收与服务业务增长维持 EPS 预期
苹果于 2026 年 4 月 30 日发布了 2026 财年第二季度财报,涵盖截至 2026 年 3 月 28 日的季度。总营收达到 1112 亿美元,同比增长 17%,摊薄后每股收益(EPS)增长 22% 至 2.01 美元。苹果表示,该季度创下了公司 3 月份季度的总营收、iPhone 营收和 EPS 纪录,同时服务业务营收也创下历史新高。
这不仅仅是一份常规的硬件周期财报。苹果第二季度的业绩证明,iPhone 需求、服务业务增长以及积极的资本回报计划仍在共同支撑着该公司强大的 EPS 增长故事。对于寻找下一个苹果财报或 AAPL 财报更新的投资者而言,未来的关键问题是,在市场等待更强劲的 AI 和产品周期催化剂之际,苹果能否维持其溢价估值。
2026/07/09

MEXC 链上观察日报:Robinhood Chain单日DEX交易量突破5.6亿美元
2026/07/10
热门
目前热门备受市场关注的加密货币
加密货币价格
按交易量计算交易量最大的加密货币