Trading Bitcoin with leverage can be profitable, but it comes with serious risks. One wrong move and your position gets liquidated, wiping out your investment in seconds. A BTC liquidation map showsTrading Bitcoin with leverage can be profitable, but it comes with serious risks. One wrong move and your position gets liquidated, wiping out your investment in seconds. A BTC liquidation map shows
新手学院/区块链百科/热门概念/How to Read...de Smarter?

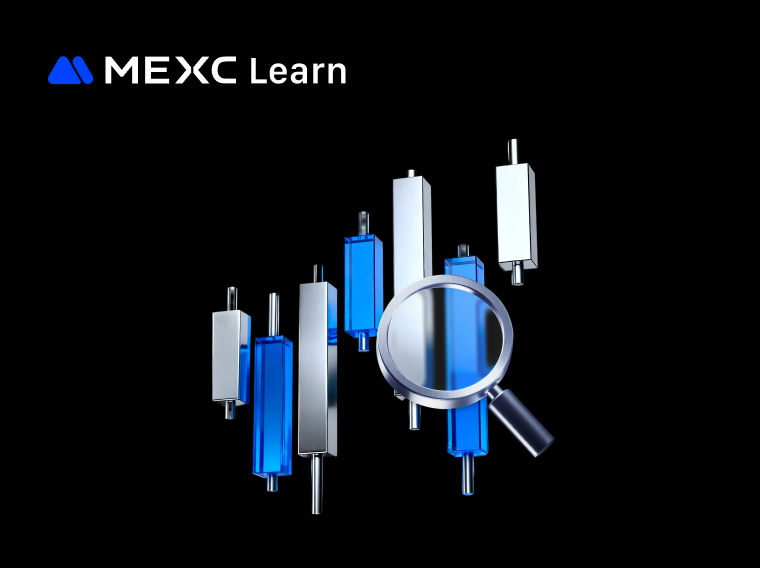
How to Read a BTC Liquidation Map and Trade Smarter?

中阶
Dec 4, 2025
0m
比特币
BTC$70,466.64+0.02%
MapNode
MAP$0.00227+0.44%
Polytrade
TRADE$0.04162-1.70%
Movement
MOVE$0.02061-2.04%
Bluefin
BLUE$0.01761+0.34%
Trading Bitcoin with leverage can be profitable, but it comes with serious risks.
One wrong move and your position gets liquidated, wiping out your investment in seconds.
A BTC liquidation map shows you exactly where these danger zones sit on the price chart.
This guide teaches you how to read these maps, spot high-risk areas, and use this information to make better trading decisions without getting caught in liquidation cascades.

New to Bitcoin? Start with our complete investment guide before advanced trading tools.


Key Takeaways
  • A BTC liquidation map visualizes price levels where leveraged traders face forced position closures.
  • Yellow zones on the map indicate high-risk areas with concentrated liquidations, while blue zones show minimal risk.
  • Liquidation zones above current price reveal long positions, while zones below show short positions.
  • Smart traders use these maps to set stop-losses, time entries, and identify profit targets before reversals occur.
  • Liquidation clusters act like magnets, often attracting price movement due to concentrated liquidity at those levels.
  • Never rely solely on liquidation data—combine maps with technical indicators, volume analysis, and market context for best results.

What Is a Bitcoin (BTC) Liquidation Map?

A bitcoin liquidation map is a visual tool that displays price levels where leveraged traders are likely to get liquidated.

First understand how Bitcoin works before diving into advanced trading concepts.

If the market moves against your trade, the exchange automatically closes your position at a specific price point to prevent further losses. This forced closure is called liquidation.
Long positions get liquidated when prices fall below a certain level. Short positions face liquidation when prices rise too high.
A liquidation map takes all these individual liquidation prices and displays them as a heatmap on your chart. High-concentration areas appear as bright yellow zones, while low-risk areas show up in blue.
The map doesn't show exact dollar amounts or contract numbers. Instead, it displays relative intensity—how significant each liquidation cluster is compared to others nearby.
Popular platforms like CoinGlass and CoinAnk provide free btc liquidation heat maps that traders can access online.


How to Read a BTC Liquidation Map?


1. Understanding the BTC Liquidity Chart Axes

The horizontal X-axis shows Bitcoin price levels across different values.
The vertical Y-axis represents liquidation intensity, measuring how much trading volume sits at each price point.
Taller bars indicate stronger potential market reactions when price reaches those levels. The height doesn't represent exact contract values but shows relative importance compared to adjacent zones.


2. Decoding Liquidation Heat Map Colors

Blue zones indicate low liquidation activity with minimal leverage concentration.
Yellow zones mark high-risk areas where massive liquidation events could trigger if price reaches those levels.
The color gradient between blue and yellow shows medium-risk zones with moderate leverage exposure.
These colors simply help you distinguish between different liquidation clusters—they carry no additional meaning beyond visual separation.


3. Identifying Long vs Short Liquidations

Liquidation zones above the current price reveal where long traders will get liquidated.

Apply this knowledge: Learn How to Short Bitcoin safely.

This tells you most traders are betting on price increases, expecting Bitcoin to move higher.
Liquidation zones below current price show where short traders face elimination.
Heavy short positioning means most traders expect prices to drop.
When you see thick yellow bars above current price, it signals overcrowded long positions vulnerable to a price spike that could trigger mass liquidations.


4. Reading Bitcoin Liquidation Map Intensity

The relative strength shown on the Y-axis helps predict market impact.
Dense, tall clusters create stronger "magnet effects" that often pull price toward those levels.
Multiple small clusters spread across a range have less predictive power than one concentrated zone.
When several liquidation levels stack close together, the combined effect amplifies potential volatility when price approaches.


Using BTC Liquidation Maps in Your Trading Strategy

Smart traders use bitcoin exchange liquidation maps to anticipate where price might move next.
Liquidation zones act like magnets because market makers and algorithms often push prices toward areas with concentrated liquidity. When thousands of positions get liquidated simultaneously, the forced buying or selling creates momentum that can cascade into more liquidations.

Learn about the factors that cause Bitcoin price drops.

You can set stop-loss orders just beyond major liquidation zones to avoid getting swept up in these events. If you spot a thick yellow zone at $95,000 and Bitcoin trades at $93,000, placing your stop at $95,200 gives you buffer room.
Entry timing improves when you wait for price to clear major liquidation clusters before opening positions. Jumping in right before a yellow zone often results in quick losses as price shoots through to trigger liquidations.
Large orders execute with less slippage when placed near high-liquidity zones because there's enough trading volume to absorb your position without moving the market significantly.
Profit targets work well when set at liquidation clusters in your favor's direction. If you're long and see heavy short liquidations at $98,000, that's a logical exit point before potential reversal.
Combining btc liquidity charts with traditional technical indicators like RSI or support-resistance levels creates a more complete trading picture. When liquidation zones align with key technical levels, the probability of significant price action increases.
Institutional players often target liquidation zones to enter or exit large positions where sufficient liquidity exists, sometimes creating volatility in the process.


Common Mistakes to Avoid with Bitcoin Liquidation Maps

  • Trading directly into yellow zones without confirming other indicators: Price doesn't always reach every liquidation cluster, especially when major news disrupts technical patterns.
  • Ignoring the broader market context: A bitcoin liquidation map current reading means nothing if regulatory announcements or macroeconomic data overwhelms technical signals.
  • Misreading color intensity as certainty: Yellow zones show probability, not guaranteed price destinations—external factors can prevent price from reaching expected levels.
  • Relying solely on liquidation data: Maps work best when combined with volume analysis, order book depth, funding rates, and traditional chart patterns.
  • Forgetting that maps update constantly: A btc liquidation map live view from morning might look completely different by afternoon as traders adjust positions.
  • Overcomplicating with too many timeframes: Switching between multiple leverage ratios and time periods creates confusion rather than clarity for most traders.
  • Assuming all liquidations trigger: Strong support or resistance can halt price movement before reaching liquidation zones, leaving those levels untouched.


Frequently Asked Questions

What does a liquidation map show?
It displays price levels where leveraged Bitcoin positions will be forcibly closed by exchanges.


How accurate are bitcoin liquidation heat maps?
They show relative probabilities based on current open positions but cannot predict external market events.


Where can I find a btc exchange liquidation map?
CoinGlass and CoinAnk offer free real-time liquidation maps for Bitcoin and other cryptocurrencies.


Can I use coinglass btc liquidation map for day trading?
Yes, day traders use these maps to identify short-term support and resistance zones created by liquidation clusters.


What's the difference between liquidation maps and liquidity charts?
A btc liquidity chart shows total order book depth while liquidation maps specifically track leveraged position risk zones.


Do liquidation maps work for all cryptocurrencies?
Most major cryptocurrencies have liquidation maps available, though Bitcoin has the most reliable data due to higher trading volume.


How often should I check bitcoin liquidation map current levels?
Active traders check hourly or before entering positions, while swing traders might review daily or before major market sessions.


What happens when price hits a yellow zone?
Mass liquidations often trigger cascading price movements as forced orders execute simultaneously.


Should beginners use btc liquidation map data?
Beginners should learn basic trading first, then gradually incorporate liquidation analysis as their skills develop.


Can liquidation maps predict Bitcoin's next move?
They indicate where significant liquidity sits but cannot predict direction without confirming signals from other technical indicators.


Conclusion

A bitcoin liquidation map gives you an edge by revealing where other traders are vulnerable.
Reading these maps correctly helps you avoid getting liquidated yourself while capitalizing on zones where others face forced exits. The color codes, axes, and cluster patterns tell a story about market positioning and potential price movement.
Start by studying maps on CoinGlass without risking real money. Compare what the btc liquidation heat map suggested against actual price action to build your pattern recognition skills.
Remember that liquidation maps work best as one tool in a complete trading strategy, not as a standalone crystal ball.


For Bitcoin basics and investment strategies, explore our ultimate BTC guide.

市场机遇
比特币 图标
比特币实时价格 (BTC)
$70,458.14
$70,458.14$70,458.14
+1.52%
USD
比特币 (BTC) 实时价格图表

热门文章

如何在MEXC盘前永续合约交易EDGE代币:全面指南助您把握DeFi新星交易机遇

如何在MEXC盘前永续合约交易EDGE代币:全面指南助您把握DeFi新星交易机遇

核心要点 EDGE代币概览:EDGE是EdgeX去中心化衍生品交易所的原生代币,在平台治理、手续费折扣和质押收益中发挥核心作用盘前交易优势:MEXC盘前永续合约允许投资者在EDGE正式上市前提前布局,把握价格发现阶段的交易机会交易便利性:MEXC交易所已上线EDGEUSDT盘前永续合约,支持最高50倍杠杆交易生态价值:EdgeX作为Base链上的创新DeFi衍生品交易平台,EDGE代币具有多重实用

如何领取EDGE代币空投:EdgeX去中心化交易所平台代币空投完整指南

如何领取EDGE代币空投:EdgeX去中心化交易所平台代币空投完整指南

关键要点 EDGE空投资格:EdgeX通过多轮活动奖励早期支持者和活跃用户,包括创世分配、TGE前赛季和社区贡献者领取时间:EDGE代币生成事件(TGE)已于2026年3月启动,符合条件的用户可以立即查看资格并领取代币领取方式:用户需要连接Base网络兼容钱包到EdgeX官方平台,验证资格后即可领取代币代币用途:EDGE是EdgeX去中心化交易所的原生代币,可用于交易手续费折扣、质押收益和治理投票

EDGE代币是什么?EdgeX交易所原生代币的全面指南

EDGE代币是什么?EdgeX交易所原生代币的全面指南

关键要点 EDGE是EdgeX的原生实用代币,这是一个建立在Base区块链上的去中心化衍生品交易所(DEX)EdgeX结合了去中心化金融的透明度和安全性,以及通常在中心化交易所才有的高级交易功能EDGE代币总供应量固定为10亿枚,采用以社区为中心的分配模式该平台提供多个加密货币交易对的永续合约交易,杠杆最高可达50倍EDGE持有者可以参与治理、享受交易手续费折扣并获得质押奖励EdgeX旨在解决传统

黄金为什么下跌,2026年3月宏观抛售背后的核心驱动力与交易策略

黄金为什么下跌,2026年3月宏观抛售背后的核心驱动力与交易策略

近期整个贵金属市场都在问同一个问题:为什么黄金在下跌?随着价格在关键支撑位 4850 美元附近苦苦挣扎,许多习惯了黄金永远上涨叙事的交易者感到措手不及。直接的导火索显然是刚刚结束的重磅宏观事件,但要真正理解这一轮抛售的底层逻辑,我们必须跳出单一的新闻头条,深入剖析目前主导全球资本流动的宏观基本面。3月美联储决议:压垮金价的鹰派重击在刚刚结束的 3 月 18 日至 19 日会议上,美联储如期按兵不动

热门加密动态

查看更多
伊朗战争2026:油价为何再度暴涨?投资者必读的生存指南

伊朗战争2026:油价为何再度暴涨?投资者必读的生存指南

发布日期: 2026年3月18日 更新日期: 2026年3月18日 阅读时长: 约12分钟 概述(Executive Summary) 2026年2月28日,美国与以色列联合发动代号"史诗狂怒行动(Operation Epic Fury)"的军事打击,伊朗战争正式爆发。这场冲突迅速演变为数十年来最严重的全球能源危机——伊朗随即宣布封锁霍尔木兹海峡,切断了全球约20%的石油与天然气供应通道。 短短三

Bitcoin (BTC) 价格预测:市场预测与分析

Bitcoin (BTC) 价格预测:市场预测与分析

了解Bitcoin (BTC) 的价格预测为交易者和投资者提供了潜在市场趋势的前瞻性视角。Bitcoin 价格预测并非保证,但它们通过结合历史表现、技术指标、市场情绪和更广泛的经济状况来预测 Bitcoin 的未来价值,从而提供宝贵的见解。 Bitcoin (BTC) 当前市场概况 Bitcoin 目前在中性到谨慎乐观的技术设置中交易,BTC 价格走势反映出在潜在机构驱动的走势之前的盘整模式[1]

黄金股票投资指南:2026年贵金属市场导航

黄金股票投资指南:2026年贵金属市场导航

1. 理解黄金投资的吸引力 在2026年初经济不确定性加剧和持续货币贬值的背景下,黄金投资继续吸引投资者。在美国与Iran之间等地缘政治紧张局势推动的避险需求下,现货黄金价格飙升至每盎司5,150美元的里程碑,贵金属股票成为对冲美元不稳定的战略工具。随着基于区块链的替代品出现,将传统避险属性与数字效率相结合,这种吸引力进一步增强。投资者被黄金相关股票吸引,因为它们在通胀飙升和货币疲软期间具有超越表

2026年黄金价格崩盘:全面分析

2026年黄金价格崩盘:全面分析

1. 理解2026年黄金市场下滑 黄金市场在2026年2月初经历了一次戏剧性的下滑,价格从接近每盎司5,600美元的历史高位暴跌超过20%,跌至4,400至4,800美元的波动区间。这次调整是自1980年代以来贵金属领域最严重的调整之一,甚至超过了2011年债务上限危机期间的波动性。作为一名拥有超过十年追踪加密货币和大宗商品市场经验的资深编辑,我的专业知识强调了这种迅速逆转的罕见性,它是由相互关联

相关文章

如何在MEXC盘前永续合约交易EDGE代币:全面指南助您把握DeFi新星交易机遇

如何在MEXC盘前永续合约交易EDGE代币:全面指南助您把握DeFi新星交易机遇

核心要点 EDGE代币概览:EDGE是EdgeX去中心化衍生品交易所的原生代币,在平台治理、手续费折扣和质押收益中发挥核心作用盘前交易优势:MEXC盘前永续合约允许投资者在EDGE正式上市前提前布局,把握价格发现阶段的交易机会交易便利性:MEXC交易所已上线EDGEUSDT盘前永续合约,支持最高50倍杠杆交易生态价值:EdgeX作为Base链上的创新DeFi衍生品交易平台,EDGE代币具有多重实用

如何领取EDGE代币空投:EdgeX去中心化交易所平台代币空投完整指南

如何领取EDGE代币空投:EdgeX去中心化交易所平台代币空投完整指南

关键要点 EDGE空投资格:EdgeX通过多轮活动奖励早期支持者和活跃用户,包括创世分配、TGE前赛季和社区贡献者领取时间:EDGE代币生成事件(TGE)已于2026年3月启动,符合条件的用户可以立即查看资格并领取代币领取方式:用户需要连接Base网络兼容钱包到EdgeX官方平台,验证资格后即可领取代币代币用途:EDGE是EdgeX去中心化交易所的原生代币,可用于交易手续费折扣、质押收益和治理投票

EDGE代币是什么?EdgeX交易所原生代币的全面指南

EDGE代币是什么?EdgeX交易所原生代币的全面指南

关键要点 EDGE是EdgeX的原生实用代币,这是一个建立在Base区块链上的去中心化衍生品交易所(DEX)EdgeX结合了去中心化金融的透明度和安全性,以及通常在中心化交易所才有的高级交易功能EDGE代币总供应量固定为10亿枚,采用以社区为中心的分配模式该平台提供多个加密货币交易对的永续合约交易,杠杆最高可达50倍EDGE持有者可以参与治理、享受交易手续费折扣并获得质押奖励EdgeX旨在解决传统

黄金为什么下跌,2026年3月宏观抛售背后的核心驱动力与交易策略

黄金为什么下跌,2026年3月宏观抛售背后的核心驱动力与交易策略

近期整个贵金属市场都在问同一个问题:为什么黄金在下跌?随着价格在关键支撑位 4850 美元附近苦苦挣扎,许多习惯了黄金永远上涨叙事的交易者感到措手不及。直接的导火索显然是刚刚结束的重磅宏观事件,但要真正理解这一轮抛售的底层逻辑,我们必须跳出单一的新闻头条,深入剖析目前主导全球资本流动的宏观基本面。3月美联储决议:压垮金价的鹰派重击在刚刚结束的 3 月 18 日至 19 日会议上,美联储如期按兵不动

注册MEXC账号
注册 & 获得高达10,000 USDT奖金