1. Today's Market: The Nasdaq Fell 2.86%, Its Largest One-Day Drop Since June
Unit: single-day change on October 30; all three readings are negative, so the zero line sits at the right edge and every bar runs left on one shared scale. The Nasdaq reads −2.86%, the S&P 500 −1.82% and the Dow −1.09%.
All three indexes fell together for a second straight day, the Nasdaq closing at 25,437, the S&P 500 at 7,580 and the Dow at 51,770; the Nasdaq's drop was its largest single-day decline since June and left it down more than 5% for October. The selling came from two cloud providers' results that week, where AI capital spending kept rising while evidence of returns lagged, and two Fed officials said publicly that rates still need to go higher, lifting expected discount rates.
The damage was uneven across stocks. Palantir fell 6.27%, and Intel briefly fell more than 25% before the open on fourth-quarter guidance below expectations, while Apple slipped only 1.22% to $344.63, about 2.0% below its 52-week high of $351.73 and one of the most resilient large technology stocks in this pullback. When discount rates rise, the pressure lands first on highly valued technology stocks, so read a decline by first separating a valuation adjustment from a company-specific problem.
2. Stock in Focus: Two of Six Automakers Rose, and Rivian Rose Most
Unit: %, single-day change on October 30. These six are large-cap automakers picked by hand on the nature of the business, drawn from both NYSE and Nasdaq listings, not an industry field; the set spans positive and negative, so a zero line is drawn and all six share one scale. Rivian sits at one end on +6.20% and NIO at the other on −3.17%, 9.37 percentage points apart.
Rivian added a further leg on top of a tailwind that day. Two averages have to be kept apart: these six averaged +0.24%, while the Nasdaq automaker industry averaged +1.72%, so the denominators differ and Rivian's 4.48 percentage points of excess is measured against the industry average; General Motors came second in the set at +1.96%, 4.24 percentage points behind. Rivian closed at $12.16, adding about $1.0B to a $17.6B market value on 62.7M shares, 2.21 times its daily average. Earnings drove it: third-quarter revenue was $2.155B, up 38%, and deliveries reached a quarterly record of 19,248 vehicles, both ahead of expectations; the new R2 outsold the R1 and the Amazon van in its first full quarter, and full-year guidance rose on deliveries, EBITDA and capital spending at once. ⚠ But total gross profit of $176M was positive while the vehicle business itself still lost $80M at the gross level; the company says the R2 turns positive only by year-end, and autonomy details are scheduled for its AI day on December 9.
Five Dimensions: Peer Rank Full, and Trend Position Weakest at 7
Unit: 0 to 100, 0 at the centre and 100 at the rim, all five axes on one scale. Peer rank reads 100, relative strength 72, volatility control 55 and valuation heat 37, and the weakest is trend position at 7.
The pair worth reading together is one high and one low: peer rank 100, trend position only 7. Relative strength is 50 plus five times the excess over the industry, so Rivian's 4.48 percentage points works out to exactly 72.4, short of the cap; trend position 7 matches a price at 6.9% of its 52-week range, one step above the year's low. One measures the session and the other the year, so ranking first for a day and where the stock stands over a year are separate questions, and a big gain is best read from the level it started at.
3. What to Watch Tonight: Apple's Fiscal Fourth Quarter, and What Its Margin Looks Like Without Tariff Refunds
At 15:00|October ISM Manufacturing PMI The first session on U.S. winter time opens at 14:30, so this reading lands 30 minutes after the open
After the close at 21:00|Apple (AAPL) fiscal fourth-quarter earnings The call is at 22:00, the new CEO's first in that role; Apple's own guidance is revenue up 9% to 11% with gross margin of 47%–48%
Also after the close|Palantir (PLTR) third-quarter earnings The stock closed at $184.11 on October 30, down 6.27%
Tuesday, November 3|U.S. midterm elections and AMD earnings after the close September JOLTS job openings follow at 15:00
Friday at 13:30|October nonfarm payrolls and unemployment rate The macro focus of the week, an hour before the U.S. open
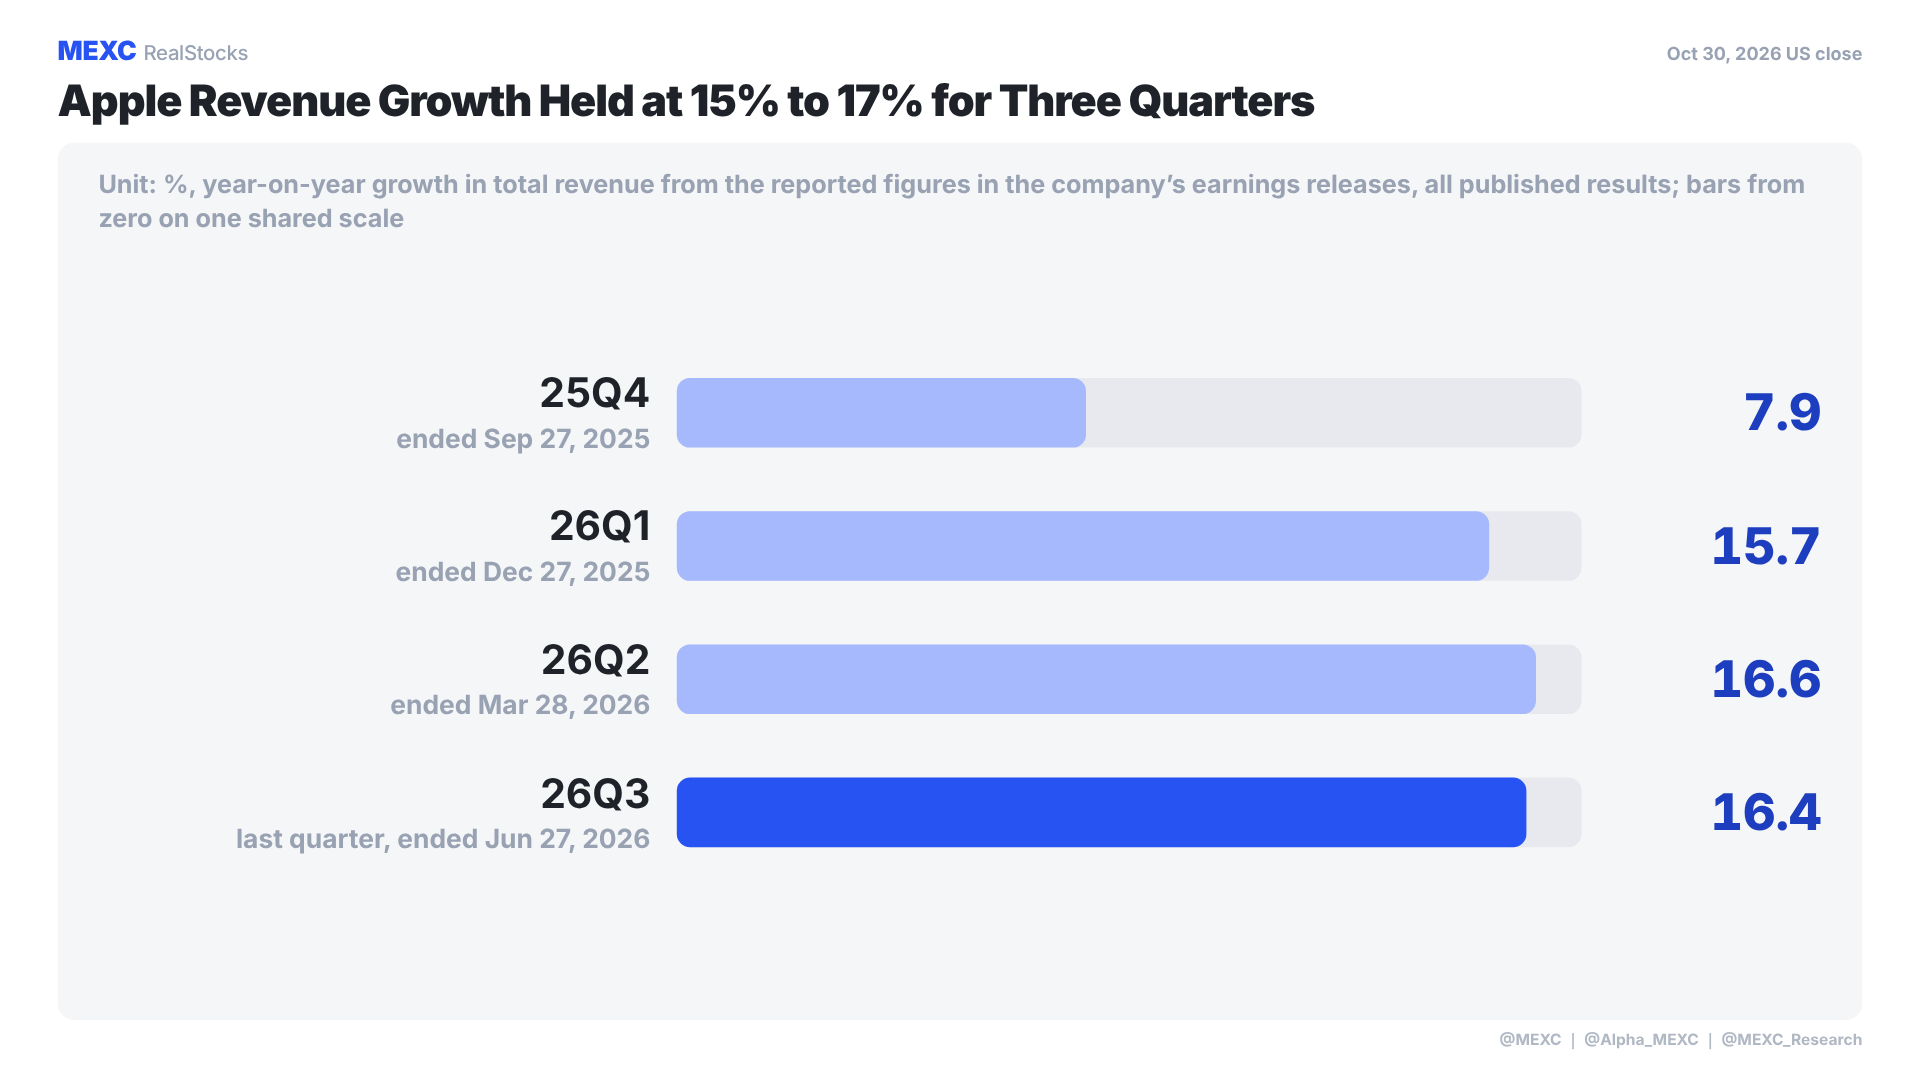
Unit: %, year-on-year growth in total revenue computed from the reported figures in the company's earnings releases; the four fiscal quarters ended September 27, 2025, December 27, 2025, March 28, 2026 and June 27, 2026, all published results, with bars from zero on one shared scale. 25Q4 reads 7.9%, 26Q1 15.7%, 26Q2 16.6% and 26Q3 16.4%.
Three quarters at 15% to 17%, but guidance of only 9% to 11% On last year's base of $102.47B that means $111.69B to $113.74B, and the low end would drop growth back to a single digit, so the question tonight is how much of the slowdown the company itself forecast actually arrives, not whether growth can accelerate
Why growth rates rather than dollar revenue Apple is highly seasonal, with $143.76B in the December quarter against only $102.47B in the September quarter, so raw revenue only draws the seasons, while year-on-year growth shows whether the business is speeding up or slowing down
⚠ Gross margin is the real test About 2 percentage points of last quarter's 50.1% gross margin came from tariff refunds, as did $0.11 of its $2.02 in earnings per share; with this quarter guided to 47%–48%, whether margin improves on its own once the one-offs are removed matters more than the headline figure
4. Frequently Asked Questions
Q: Rivian's total gross profit turned positive, so why say it still loses money building cars?
A: Gross profit adds up every business line, so positives and negatives can cover each other. Rivian's third-quarter gross profit was $176M, but split apart, software and services earned $256M at a 42% margin while the vehicle business lost $80M, and $354M of software and services came from the joint venture agreement with Volkswagen, recognized as work progresses through mid-2028. Ask first whether the money came from selling cars or selling technology, because the two do not last the same way. The company says the R2 turns positive by year-end, and that is the next checkpoint.
Q: The Nasdaq fell 2.86% and Rivian rose 6.20%. Was that moving against the market?
A: Not in the sense that matters. The fair comparison is its own industry, not the broad index: the Nasdaq automaker industry averaged +1.72% that day, a tailwind, and the six hand-picked automakers averaged +0.24% with only two rising. Rivian's 4.48 percentage points of excess over the industry lines up with revenue and deliveries that both beat expectations. To judge whether a stock moved against the tide, first check which way its own industry went that day; a gap with the index only shows it moved differently from technology stocks.
Q: Apple's revenue grew 16.4% last quarter. Which product line carried it?
A: Of last quarter's $109.42B in revenue, iPhone brought in $54.25B, or 49.6%, and grew 21.7%, which largely set the overall 16.4%. Mac grew faster at 28.7% but is only a fifth the size of iPhone, so it cannot move the total, and iPad fell 5.9%, the only line that shrank. Services brought in $30.74B and grew 12.1%, not the fastest, but its gross margin is far above hardware, and it is the piece that held overall gross margin at 50.1%. Weigh each growth rate by its size, which puts iPhone and services first tonight.
The data in this article is as of the October 30 US close and all times are UTC; guidance and expectations are company or market statements, not published figures.
Disclaimer: This article is compiled and written by the MEXC RealStocks team. The data in this article is based on the closing of the US stock market on October 30, 2026. The content is a compilation of public market information, and individual stocks are publicly discussed targets, which do not represent the recommendation or opinion of MEXC and do not constitute any investment advice. More US stock content: @MEXC | @Alpha_MEXC | @MEXC_Research