How Consolidation Ranges Build the Conditions for New Trends
Consolidation ranges look inactive. Price moves between two levels, reverses, repeats. Most traders treat this as noise - time lost between real moves.
But a range is not a pause. It is a structural process. The longer it holds, the more it builds toward resolution. And when it resolves, the move that follows is usually fast, directional, and difficult to enter cleanly.
Understanding why ranges end - and what ends them - gives traders a more useful frame than simply watching for a candle close above resistance.
What a Range Actually Is
Inside a consolidation, two sides compete. Buyers absorb selling at range lows, sellers absorb buying at range highs. As long as both sides remain roughly matched, price oscillates between the boundaries.
This is not random. It is active. Positions are being built, transferred, and adjusted on both sides. The flat price chart reflects a balance of forces - but balance in markets is temporary.
Three structural forces work constantly to push a range toward resolution.
Liquidity Depletion at the Extremes
Each time price tests a range boundary and reverses, it fills orders. Stop-losses from participants on the wrong side get hit. Limit orders from participants on the right side get filled. Those participants are now out of the position - they are no longer providing liquidity at that level.
After three, four, five tests of the same level, the order flow sitting there has been materially reduced. The structural support for the range boundary erodes with each visit. The level that looked like a wall becomes thinner each time it holds.
This is why ranges that have been tested many times often resolve from the most-tested side. The liquidity at that extreme has been consumed. The pressure it once absorbed is no longer there to stop the next push.
Position Imbalance Builds Over Time
Not all participants inside a range carry equal conviction. Some are building positions systematically. Others are fading the extremes with diminishing confidence.
Over time, one side accumulates more committed size than the other. This imbalance does not appear on a price chart. It only becomes visible when the range breaks and the weaker side is forced to exit simultaneously. That forced exit is the fuel for the trend's opening leg.
The breakout does not create the imbalance. The imbalance creates the breakout.
Higher-Timeframe Flow Reasserts Direction
Ranges exist within larger structures. A consolidation on a four-hour chart often sits inside a weekly or monthly trend. The higher-timeframe directional bias does not disappear during consolidation - it pauses.
When the pause ends, the dominant flow reasserts. Ranges that form after strong directional moves tend to resolve in the direction of the prior move. The longer-timeframe structure was never negated, only temporarily compressed.
External catalysts - macro data, sector rotation, liquidity conditions - can accelerate this reassertion. But the direction of resolution is often established by structure before the catalyst appears.
Why Repeated Tests Change the Dynamic
Consider what happens to traders who bought near the top of a range when price tests that level for the fifth time. They are near breakeven or slightly in profit. Many will exit rather than hold through another potential rejection.
That selling adds to the overhead pressure at the same level that previously attracted buyers. The range high that once pulled price back up now pushes it back down. The behavior of participants at that level has inverted - not because the level changed, but because the composition of participants at it changed.
This mechanical reversal in order flow behavior is one reason why heavily tested range boundaries often give way suddenly when they finally break. The structural case for holding at that level has been replaced by structural pressure against it.
Compression Precedes Expansion
Ranges rarely break from full-width oscillation. More commonly, price movement within the range narrows before the breakout. Swings toward range extremes become shorter, slower, and fail to reach prior highs or lows.
This contraction signals that one side is running low on participants willing to push. The range is compressing under structural imbalance. When contraction gives way to expansion, the move tends to be faster and more sustained - because the imbalance has had more time to accumulate.
A breakout from a compressed, heavily tested range is structurally different from a breakout from a two-touch range with a short formation period. The first represents resolved structure. The second is still being negotiated.
What Happens Just After the Break
Stop-losses from participants who positioned inside the range accumulate just beyond the boundaries. When a breakout occurs, it moves into that liquidity - sweeping the stops of traders who were positioned at the extremes.
This sweep is not incidental. It provides the initial impulse for the trend's first leg. The new trend begins by absorbing the exits of the trapped side, and that absorption creates directional momentum that continues until the next structural level.
What looks like aggressive buying or selling after a breakout is often the mechanical clearing of one-sided exposure built up inside the range.
Bitcoin's Late 2023 Range as an Example
Bitcoin consolidated between approximately $25,000 and $30,000 across several months in 2023. The $30,000 level was tested repeatedly and rejected each time. It appeared to be strong resistance.
But each test was also clearing offers. Sellers who placed orders at $30,000 were being filled and removed from the book. By the fifth and sixth tests, the supply at that level had thinned considerably.
At the same time, longer-timeframe demand related to the 2024 halving cycle was building structural pressure from above. When price broke above $30,000 in October 2023, it reached $35,000 within weeks - not because buyers became more aggressive, but because the structural resistance had already been consumed by the repeated testing. The move entered a thinner environment and accelerated.
The range had resolved mechanically before the breakout candle printed.
Reading a Range Differently
Instead of asking whether a range will break up or down, structural reading involves different questions: Which boundary has been tested more times? Where are trapped positions most concentrated? Is the swing behavior within the range compressing or holding constant?
These questions shift attention from the event - the breakout - to the process that makes the event likely. A range that shows many boundary tests, narrowing internal swings, and clear one-sided trapped exposure is not the same as a fresh range with balanced positioning.
Timing a range break precisely is difficult. Reading the structural state of a range - how developed, how imbalanced, how depleted - is a more durable skill.
Takeaway
Ranges end because the balance that sustained them is consumed. Liquidity at the boundaries depletes, position imbalance accumulates, and higher-timeframe directional pressure eventually reasserts.
The range itself generates the conditions for its resolution. The longer it holds without breaking, the more structurally loaded the eventual break becomes. When it resolves, the move reflects everything that built up during the consolidation - not a new event, but the completion of a process that was already underway.
More market observations at https://swaphunt.dev


You May Also Like
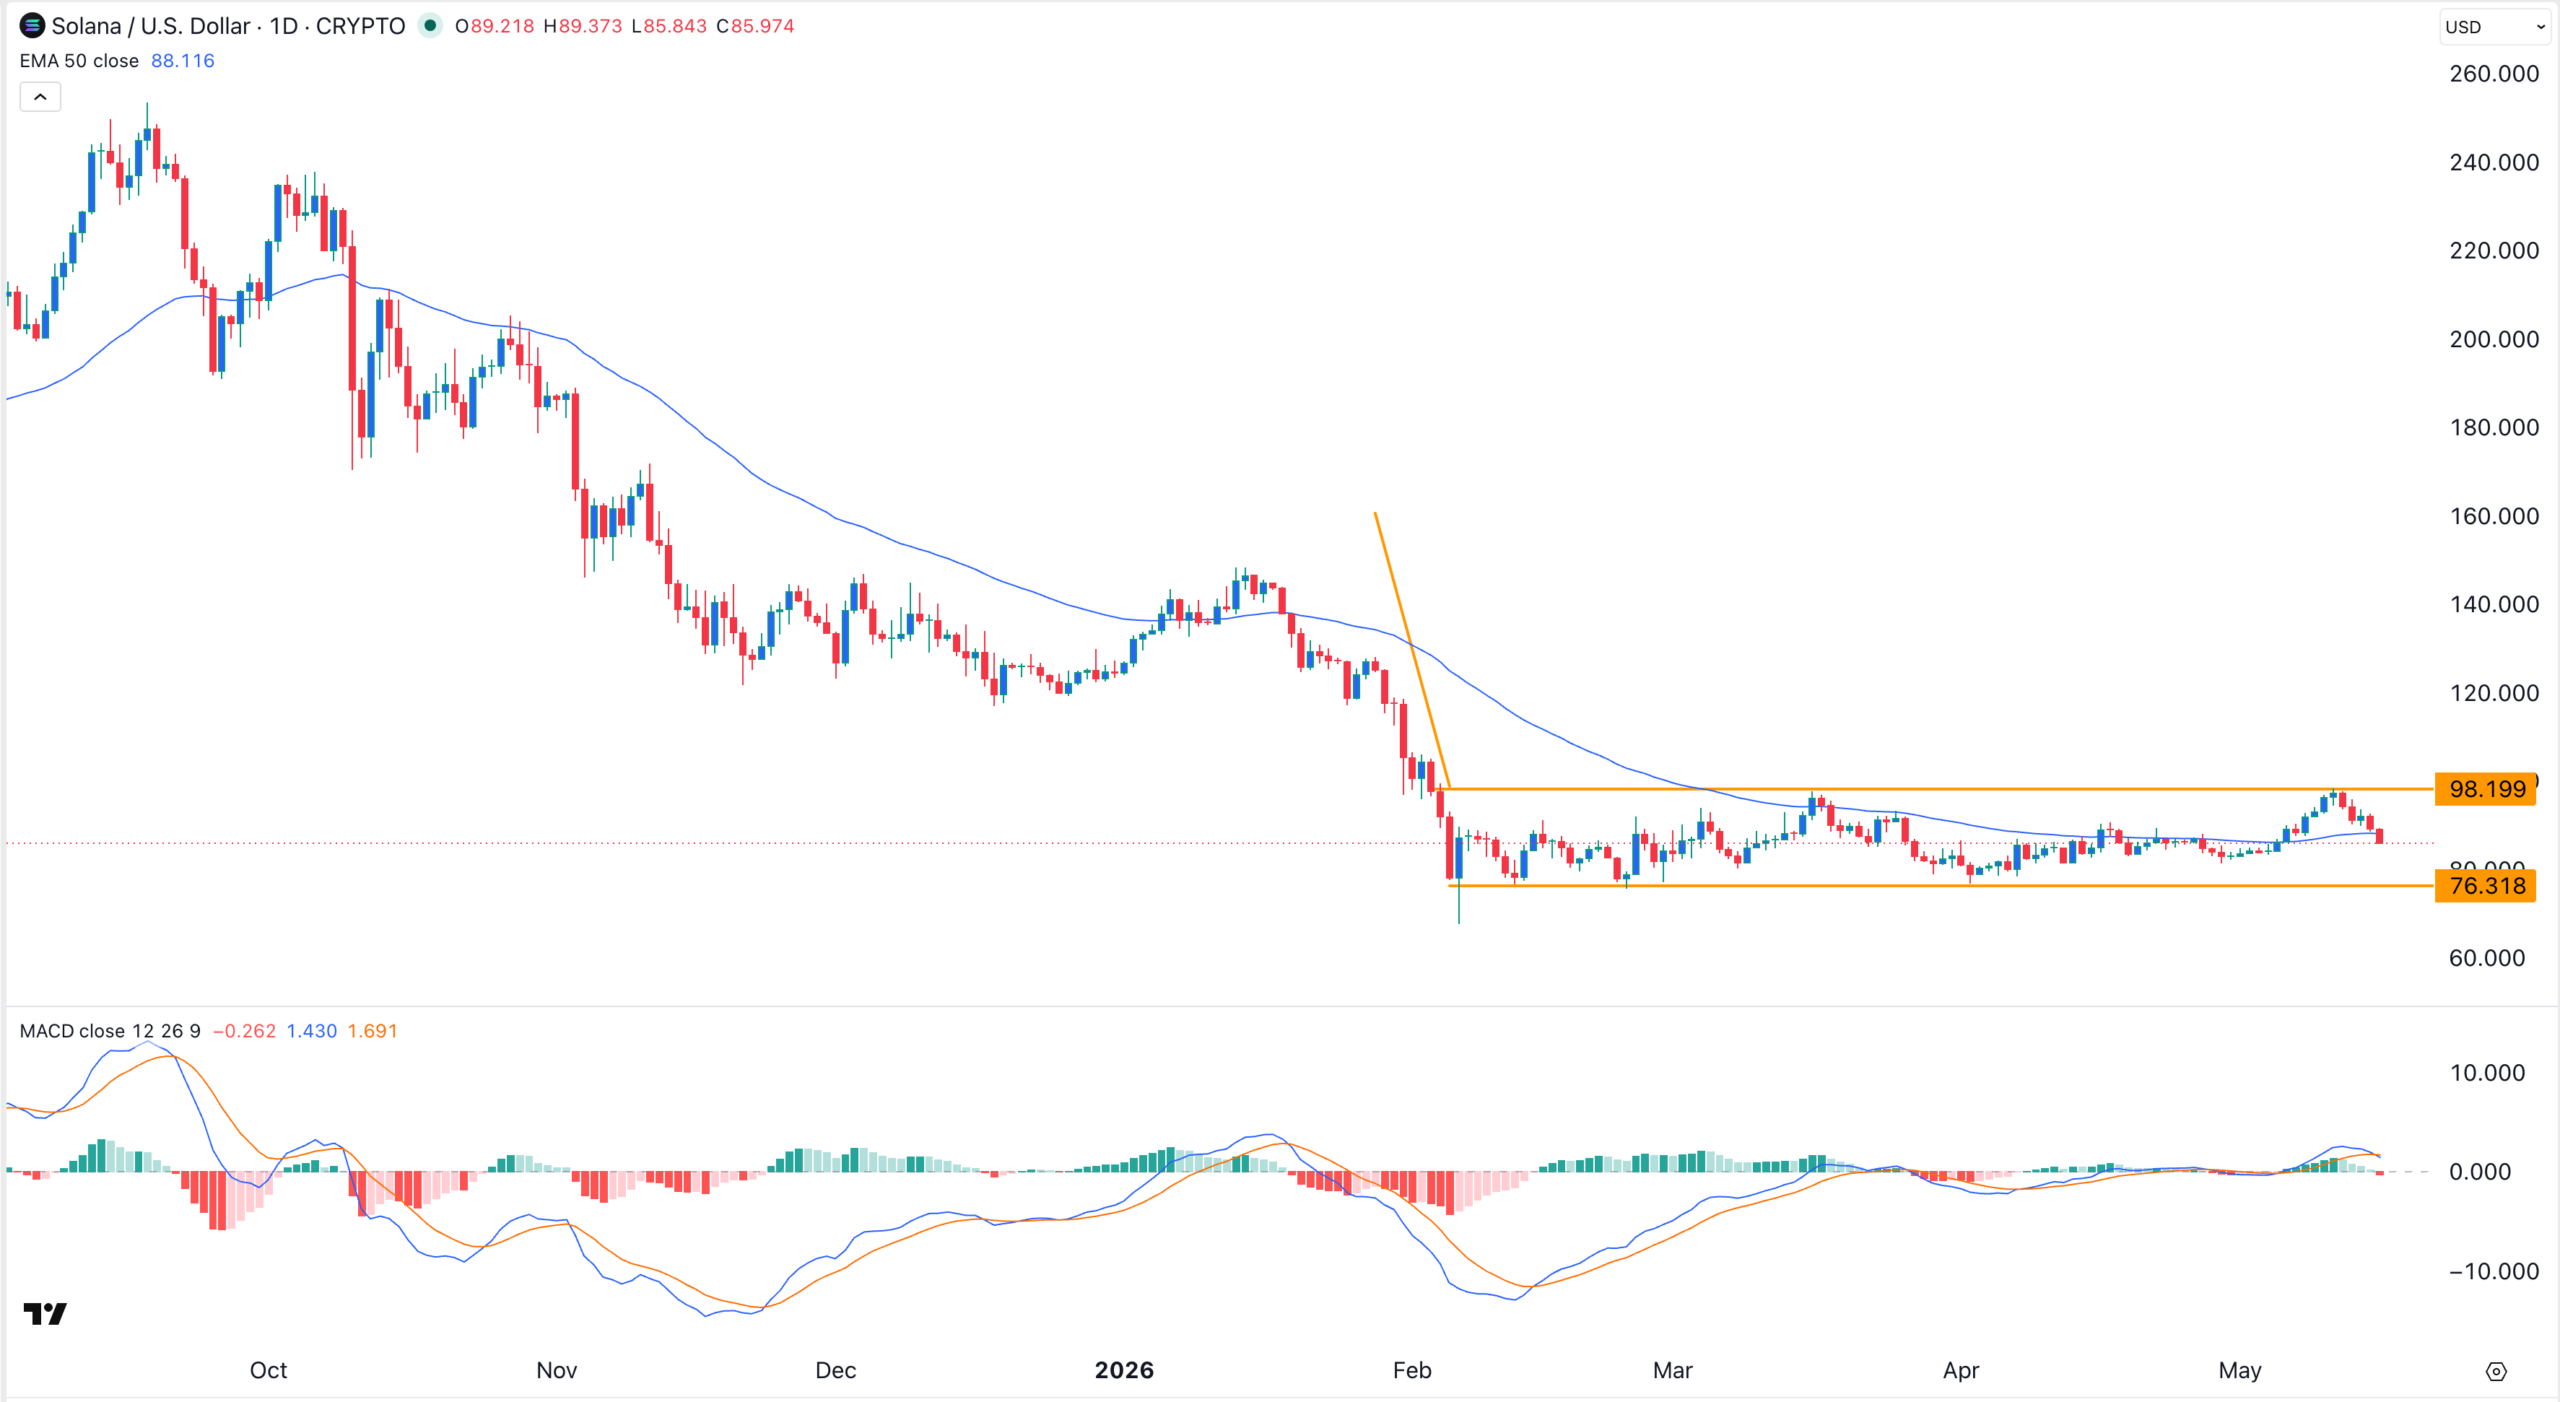
Solana Price is Hanging on a Thread as Crypto Fear and Greed Index Falls
House Agriculture Leaders Urge Trump to Nominate Full CFTC Commission as CLARITY Act Moves Forward