

Why is Crypto Down? It’s Not "FUD"—It’s the Hard Asset Rotation & Pre-CNY Liquidity Void
If you are looking for a specific news headline to explain today's red candles, stop looking. There isn't one.
Retail traders are currently scouring Twitter for "FUD" (Fear, Uncertainty, Doubt) to blame for the drop. But if you sit on an institutional trading desk, the picture is different. The market didn't crash because of a regulatory rumor or a hack. It crashed because of market mechanics and a massive, silent capital rotation.
We are witnessing a "Liquidity Flush" driven by three specific factors that algos react to long before humans do: Negative Gamma hedging, the Pre-Holiday liquidity drain, and a sudden flight to Industrial Scarcity.
Here is the raw breakdown of what is actually happening in the order books.
The "Great Rotation" to Hard Assets
The most critical signal right now is not on the Bitcoin chart—it’s on the Commodities board.
For the past six months, Bitcoin acted as a high-beta proxy for tech stocks. Today, that correlation snapped. As tracked by TradingEconomics Commodities Data, while crypto bleeds, Palladium (XPD) and Copper (XCU) are breaking out to new local highs.
This is not a coincidence. Smart money is aggressively rebalancing. The "Commodity Supercycle" narrative—driven by AI infrastructure needs and supply shocks in Russia/South Africa—is sucking liquidity out of "Digital Risk" (Crypto) and moving it into "Physical Scarcity" (RWA).
Funds aren't leaving the ecosystem; they are just changing lanes. They are selling liquid BTC/ETH positions to chase the breakout in XPD and XCU futures on MEXC. If you are only watching crypto, you are seeing a crash. If you are watching the full macro terminal, you are seeing a rotation.
The "Negative Gamma" Doom Loop
Why was the drop so fast? Why did we wipe out weeks of gains in hours?
Blame the Options Market. According to derivatives data from Coinglass, Open Interest (OI) had reached fever-pitch levels leading up to this week. Crucially, Market Makers were heavily positioned in what quantitative traders call "Negative Gamma".
When the price cracked key support levels (triggered by the rotation mentioned above), Market Makers were mathematically forced to sell spot to hedge their books. This creates a mechanical feedback loop:
Price ticks down → Dealers forced to sell → Price drops further → Dealers sell more.
This "Gamma Squeeze" explains the vertical nature of the red candles. It wasn't human panic; it was hedging algorithms executing mandatory sell orders into a thin order book.
The "Pre-CNY" Liquidity Void
Finally, look at the calendar. We are two weeks away from the Lunar New Year.
Veterans of this market know the drill: The "Asian Bid" disappears in early February. As noted in historical volatility reports, the weeks preceding the Lunar New Year often see a withdrawal of fiat liquidity as OTC desks in Asia settle accounts and miners cash out for end-of-year bonuses.
This creates a "Liquidity Void." The buy-side depth on order books is currently at its thinnest point of the quarter. In this environment, a standard sell order causes significant Slippage. The bears know this, and they are pressing their advantage while the bulls are on holiday.
The Trader’s Verdict: Watch the "Borrow"
So, is the bull market over? Unlikely. This is a structural flush, not a fundamental breakdown.
But don't try to catch the falling knife based on RSI divergence. Instead, watch the USDT Borrowing Rates on-chain via DefiLlama Yields.
The Signal: We need to see USDT borrowing costs spike on protocols like Aave. That indicates smart money is stepping in to buy the dip with leverage. Until then, cash (or Commodities like XPD) is king.
The Bottom Line: The capital hasn't evaporated; it has rotated. The savvy trader on MEXC isn't panic-selling Bitcoin; they are likely shorting the weakness or following the smart money into the Palladium (XPD) and Copper (XCU) volatility while the crypto dust settles.
⚠️ Professional Market Note
Volatility Expansion: In a "Negative Gamma" regime, support levels are less effective. Price often overshoots to the downside. Standard technical analysis (Support/Resistance) is less reliable than Volume Profile analysis during these flushes. Derivatives Risk: Buying the dip with leverage during a "Liquidity Void" is dangerous. Wicks can be deeper than expected. Ensure you have ample collateral or stick to Spot markets until the Asian liquidity returns post-holiday. Not Financial Advice: This commentary reflects market structure analysis and is not financial advice. DYOR.
Articles populaires
Voir plus
DeSci : Comment la science décentralisée redéfinit l'écosystème mondial de la recherche
Dans le modèle traditionnel de la recherche, la centralisation des ressources scientifiques et des données a limité de nombreux projets prometteurs, les empêchant de recevoir un soutien adéquat. Paral

Qu'est-ce qu'un ordre de Stop-Loss garanti sur les contrats à terme MEXC ?
1. Qu'est-ce qu'un ordre de Stop-Loss garanti sur les contrats à terme MEXC ? Un ordre de Stop-Loss garanti sur les contrats à terme est une fonctionnalité professionnelle de gestion du risque payante

Différents types d'ordres au comptant
La plateforme de trading au comptant de MEXC propose cinq types d'ordres : Ordre Limit, Ordre Market, TP/SL, OCO et ordre Stop suiveur. 1. Ordres Limit Les ordres Limit vous permettent de définir un p
Guide complet sur le Take-Profit et le Stop-Loss dans le trading des contrats à terme : gestion des risques essentielle et conseils pratiques pour les débutants
Sur le marché des cryptomonnaies, les mouvements de prix peuvent être extrêmement volatils, et les profits ou pertes peuvent survenir en un instant. Pour les traders de contrats à terme, les ordres Ta
Actualités tendance
Voir plus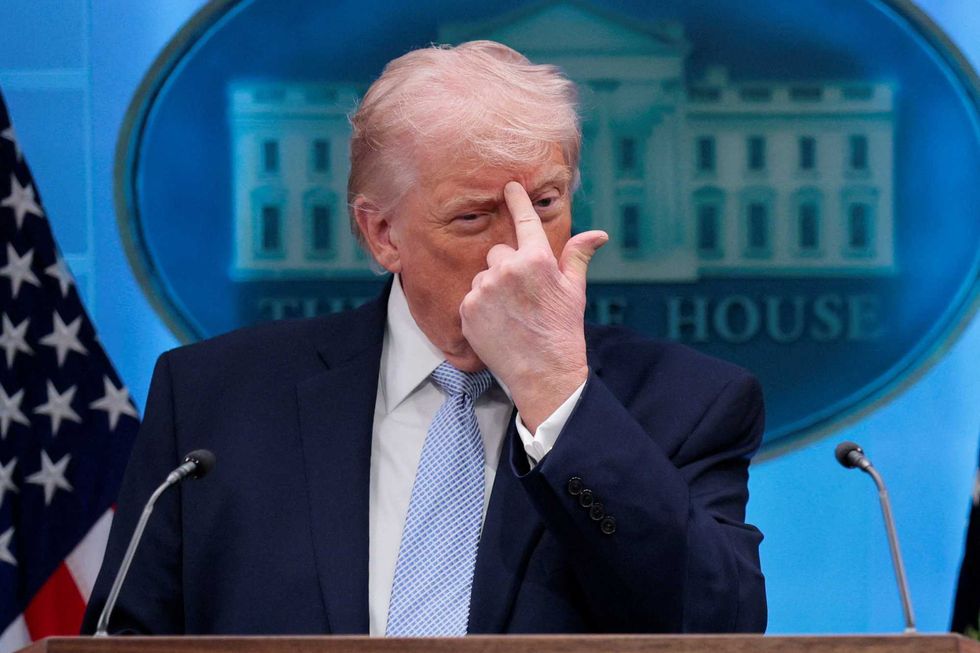
Un historien de renom affirme que Trump commet un « suicide de superpuissance »
Au cours du second mandat du président Donald Trump, les États-Unis et le monde entier ont été plongés dans le chaos par les actions erratiques de son administration

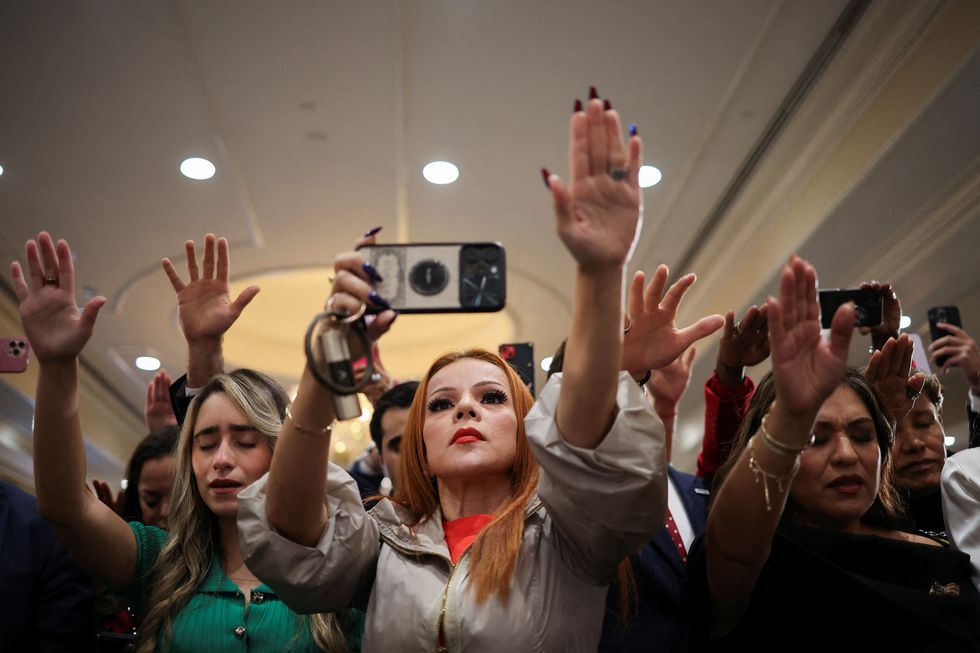
La fraude Crypto et l'extorsion numérique explosent alors que les cybercriminels utilisent l'IA
La logique complexe des tokens de Resolv Labs n'était pas la source des vulnérabilités. Illustration : Darren Joseph ; Photos : Shutterstock, Freepik.

Articles connexes
Voir plus
Guide de Trading Futu Holdings (FUTU) : Analyse du Baromètre de la Tech Chinoise pour 2026
Futu Holdings (Nasdaq: FUTU) s'est imposé comme bien plus qu'un simple courtier ; pour de nombreux investisseurs mondiaux,l'action Futusert de proxy à bêta élevé pour l'ensemble du secteur technologiq

Baisse des taux de Powell et ATH d'ETH : qu'est-ce qui alimente le rallye du marché ?
22 août 2025 — Le président de la Réserve fédérale américaine, Jerome Powell, a livré ce que les marchés ont largement interprété comme un signal fort de futures baisses de taux lors de son discours p

Adoption de la loi GENIUS : un tournant pour permettre à l'USDC de dépasser l'USDT ?
Récemment, le président américain Donald Trump a officiellement signé le GENIUS Act à la Maison-Blanche. Cette législation historique marque non seulement l'inclusion officielle de l'industrie des sta

Ethereum (ETH) repasse les 3 400 $ : début d'un nouveau bull market ou simple rebond de court terme ?
En juillet 2025, le marché des cryptomonnaies a connu une envolée historique. Le Bitcoin (BTC) a franchi le seuil des 120 000 $, attirant tous les regards, tandis qu'Ethereum (ETH) a suivi de près, at
