

What are Fibonacci Retracements?
Fibonacci Sequence
The Meaning and Purpose of Fibonacci Retracements
How to Use Fibonacci Retracements
Popular Articles
View More
What is Pi Coin? Complete Guide to Pi Network Value, Price & How to Sell Pi Coin
Pi Network has emerged as one of the most accessible cryptocurrency projects in the digital asset space, allowing users to mine Pi coins directly from their smartphones without specialized equipment

Pi Network KYC Deadline March 14, 2025: Complete Guide to Verification
Pi Network has extended its KYC (Know Your Customer) deadline to March 14, 2025, 08:00 (UTC), marking the final opportunity for Pioneers to secure their digital assets. This last extension coincides

Polkadot Tokenomics Explained: Max Supply, Inflation Rate, and DOT vs. Solana
Polkadot (DOT) is a layer-0 blockchain protocol that uses its native token for governance, staking, and purchasing network blockspace. In January 2026, Polkadot introduced a hard supply cap of 2.1

Hot Crypto Updates
View More
Tesla Pi Phone: Groundbreaking Tech or the Internet's Biggest Hoax?
Is the Tesla Pi Phone 2026 real? We cut through the hype to examine the Starlink connectivity, Neuralink BCI, and solar charging rumors — and what Elon Musk actually said. Key Takeaways As of April

Pi Network Price Prediction 2026: Can This Mobile Mining Pioneer Reclaim Its Glory?
Pi Network (PI) 2026 Price Prediction: Expert analysis reveals $0.188 current price with forecasts ranging $0.20-$3.50. Discover key price drivers, technical analysis, market outlook, and why MEXC


Trending News
View More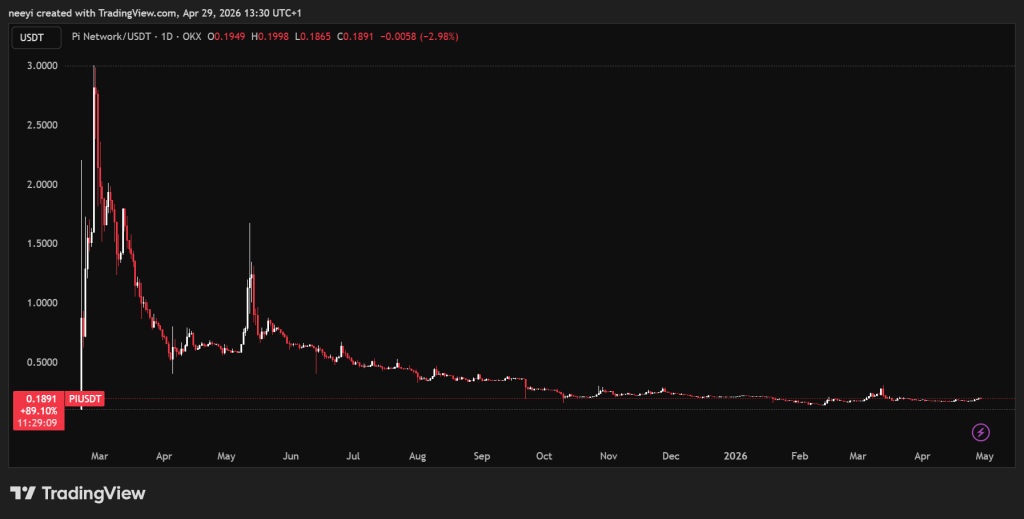
Pi Network (PI) Price Prediction 2030: New All-Time High Still Looks Distant
Pi Network entered the market with huge expectations, and early hype pushed PI coin close to an all-time high near $3. That excitement has faded over time, and
Pi Network News: Token Reclaims $2 Billion Market Cap as Consensus Week Approaches Fast
The post Pi Network News: Token Reclaims $2 Billion Market Cap as Consensus Week Approaches Fast appeared first on Coinpedia Fintech News Pi Network had crossed


Related Articles
View More
How to Use TradingView on MEXC
TradingView is a powerful trading analysis tool that caters to users of all experience levels. MEXC has integrated TradingView's charting tools, allowing you to use them directly on the MEXC platform.

Analysis of Common Technical Indicators in the Cryptocurrency Market
In crypto trading, technical indicator analysis refers to a quantitative method that uses mathematical and statistical formulas to assess market trends. By processing price and volume data through spe

What Is the Stochastic Indicator (KDJ)?
The Stochastic Indicator (KDJ) is a technical analysis tool that analyzes price trends to assess market strength and identify overbought and oversold conditions, helping traders make buy and sell deci

