

Japan Election Sparks Global Rally: Bitcoin Hits $72K, Gold Tops $5,000
TLDR
- Japan’s Nikkei 225 jumped 3.4% to breach 57,000 for the first time after Prime Minister Sanae Takaichi’s supermajority election win
- Takaichi’s Liberal Democratic Party secured a two-thirds supermajority in Japan’s 465-seat lower house
- Bitcoin rose to $72,000 and gold crossed $5,000 per ounce in response to the election results
- The victory gives Takaichi a mandate to pursue her $135 billion stimulus package with infrastructure spending and tax cuts
- U.S. President Donald Trump congratulated Takaichi on her win, while the Dow Jones crossed 50,000 for the first time on Friday
Japanese stocks reached record highs on Monday as investors reacted to Prime Minister Sanae Takaichi’s decisive election victory. The Nikkei 225 surged 3.4% to cross the 57,000 mark for the first time in history.
The ruling Liberal Democratic Party captured a two-thirds supermajority in the 465-seat lower house, according to public broadcaster NHK. This outcome gives Takaichi a strong mandate to implement her economic agenda.
The Prime Minister plans to roll out a $135 billion stimulus package focused on infrastructure spending and tax cuts. This expansionary fiscal policy aims to revitalize Japan’s economy through government investment.
The election results triggered what traders are calling the “Takaichi Trade” across global markets. Gold prices surged past $5,000 per ounce for the first time. Bitcoin reached a brief peak of $72,000 before settling above $70,000 during Asian morning trading.
The real estate sector led Nikkei gains, rising over 7% on the day. Healthcare and industrial sectors also posted strong advances. Japanese internet company CyberAgent Inc jumped more than 16%, while semiconductor equipment maker Advantest surged over 12%.
The Japanese yen strengthened to 156.88 against the dollar. Yields on 10-year Japanese government bonds rose nearly 4 basis points to 2.274%.
Market Reaction Spreads Across Asia
Other Asian markets followed Japan’s lead with broad gains. South Korea’s Kospi jumped 4.15%, while Australia’s S&P/ASX 200 rose 1.65%. Hong Kong’s Hang Seng Index climbed 1.5%, and China’s CSI 300 added 0.9%.
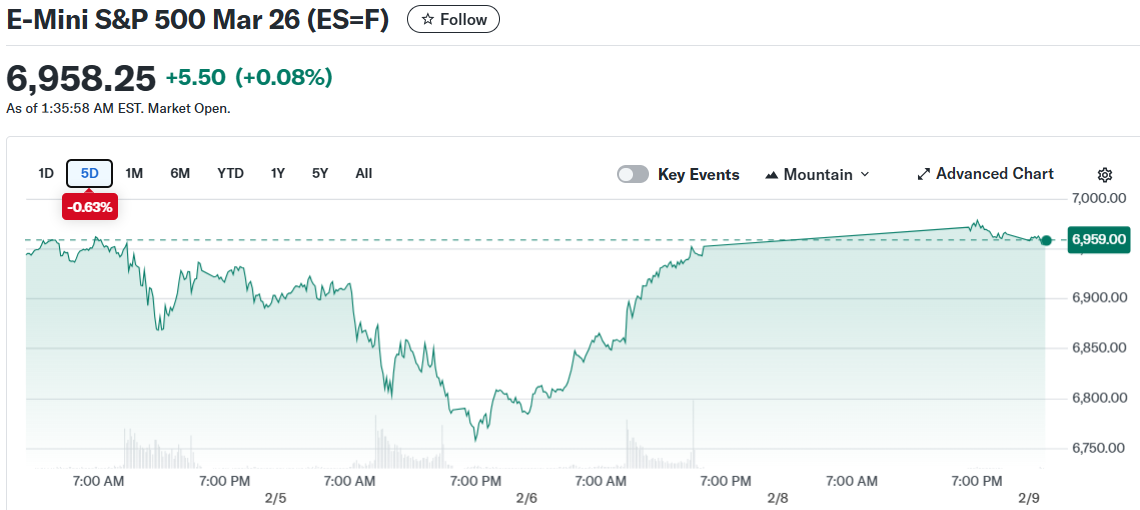 E-Mini S&P 500 Mar 26 (ES=F)
U.S. stock market futures opened higher in early Asian trading hours. The positive sentiment carried over from Friday’s strong close on Wall Street.
The election follows political upheaval for the LDP last year. The party lost its majority in the Upper House and suffered a Lower House defeat in 2024. Then-Prime Minister Shigeru Ishiba resigned in September after these losses.
Economic Policy Outlook
Sree Kochugovindan, senior research economist at Aberdeen Investments, called the decisive win the “best outcome” for markets over the medium term. He cited strategic investments and tax reform as factors that could bolster Japanese equities.
Japanese stocks have been hitting new highs over recent months. This rally has been driven by expectations that Takaichi’s policies would continue growth-focused economic measures. Markets expect her to push for looser monetary policy and higher government spending.
Crédit Agricole CIB said in a note that Takaichi’s administration gained stronger momentum to pursue proactive fiscal policy. The clear public mandate backs this major policy shift.
On Friday, the Dow Jones Industrial Average breached 50,000 for the first time, closing at 50,115.67. Trump has set a goal of reaching 100,000 on the Dow by the end of his term.
The post Japan Election Sparks Global Rally: Bitcoin Hits $72K, Gold Tops $5,000 appeared first on CoinCentral.


You May Also Like

Bitcoin (BTC) Hovers Above $77K Amid Iran Diplomacy and Rising Treasury Yields

Beyond Cleaning: What Else You Must Check Before Moving Out


