

Solana price stalls near $85 after mid-band rejection and trend failure
Solana price is hovering near $85 as falling volume, shrinking open interest, and a weak chart structure keep downside risk in focus.
- Solana has lost 35% over the past month and nearly 70% from its all-time high as price struggles below key levels.
- Derivatives activity continues to fade with recent sessions seeing significant long positions flushed out.
- Technical signals are bearish and momentum is showing oversold conditions without a clear reversal.
Solana was trading around $86.02 at press time, down 0.1% over the past 24 hours. The token has struggled to find a footing after a sharp pullback, falling about 13% over the past week and roughly 35% over the last 30 days. From its January 2025 all-time high near $293, SOL is now down close to 70%.
Price action has stayed heavy. While Solana (SOL) briefly pushed higher earlier this month, those gains faded quickly, pushing the token back toward the lower end of its recent seven-day range between $75.76 and $104.98. Buyers have stepped in to provide near support, but follow-through has been limited.
Market activity has continued to slow. Spot trading volume over the past 24 hours fell nearly 36% to $3.72 billion, pointing to fading participation. Futures data shows a similar picture.
According to CoinGlass data, derivatives volume dropped 22.44% to $9.46 billion, while open interest slipped 2.34% to $5.29 billion, suggesting traders are reducing exposure rather than adding new positions.
Risk-off sentiment and leverage unwinds add pressure
Solana’s weakness comes as risk appetite across global markets remains fragile.
Rising geopolitical tensions and a more hawkish approach by U.S. policymakers have put pressure on high-volatility assets. Known for being a high beta, SOL has been hit more severely than many of its peers.
Within crypto markets, leverage has been steadily flushed out. Recent sessions have seen liquidity sweeps wipe out billions in long positions, accelerating declines. While Solana’s open interest has occasionally increased alongside negative funding rates, this has more often been due to aggressive short positioning rather than new bullish bets.
Sentiment has also been impacted by structural issues with the network. The number of validators has fallen by about 70% from its peak to less than 800, which raises concerns about the long-term viability of operations for smaller operators.
Discussions about inflation, value capture, and stake concentration have raised caution, especially as the sector’s memecoin-driven momentum waned.
Solana price technical analysis
On the chart, Solana continues to trade within a clearly defined bearish structure. Price was rejected near the Bollinger mid-band around $108, and the sequence of lower highs remains intact.
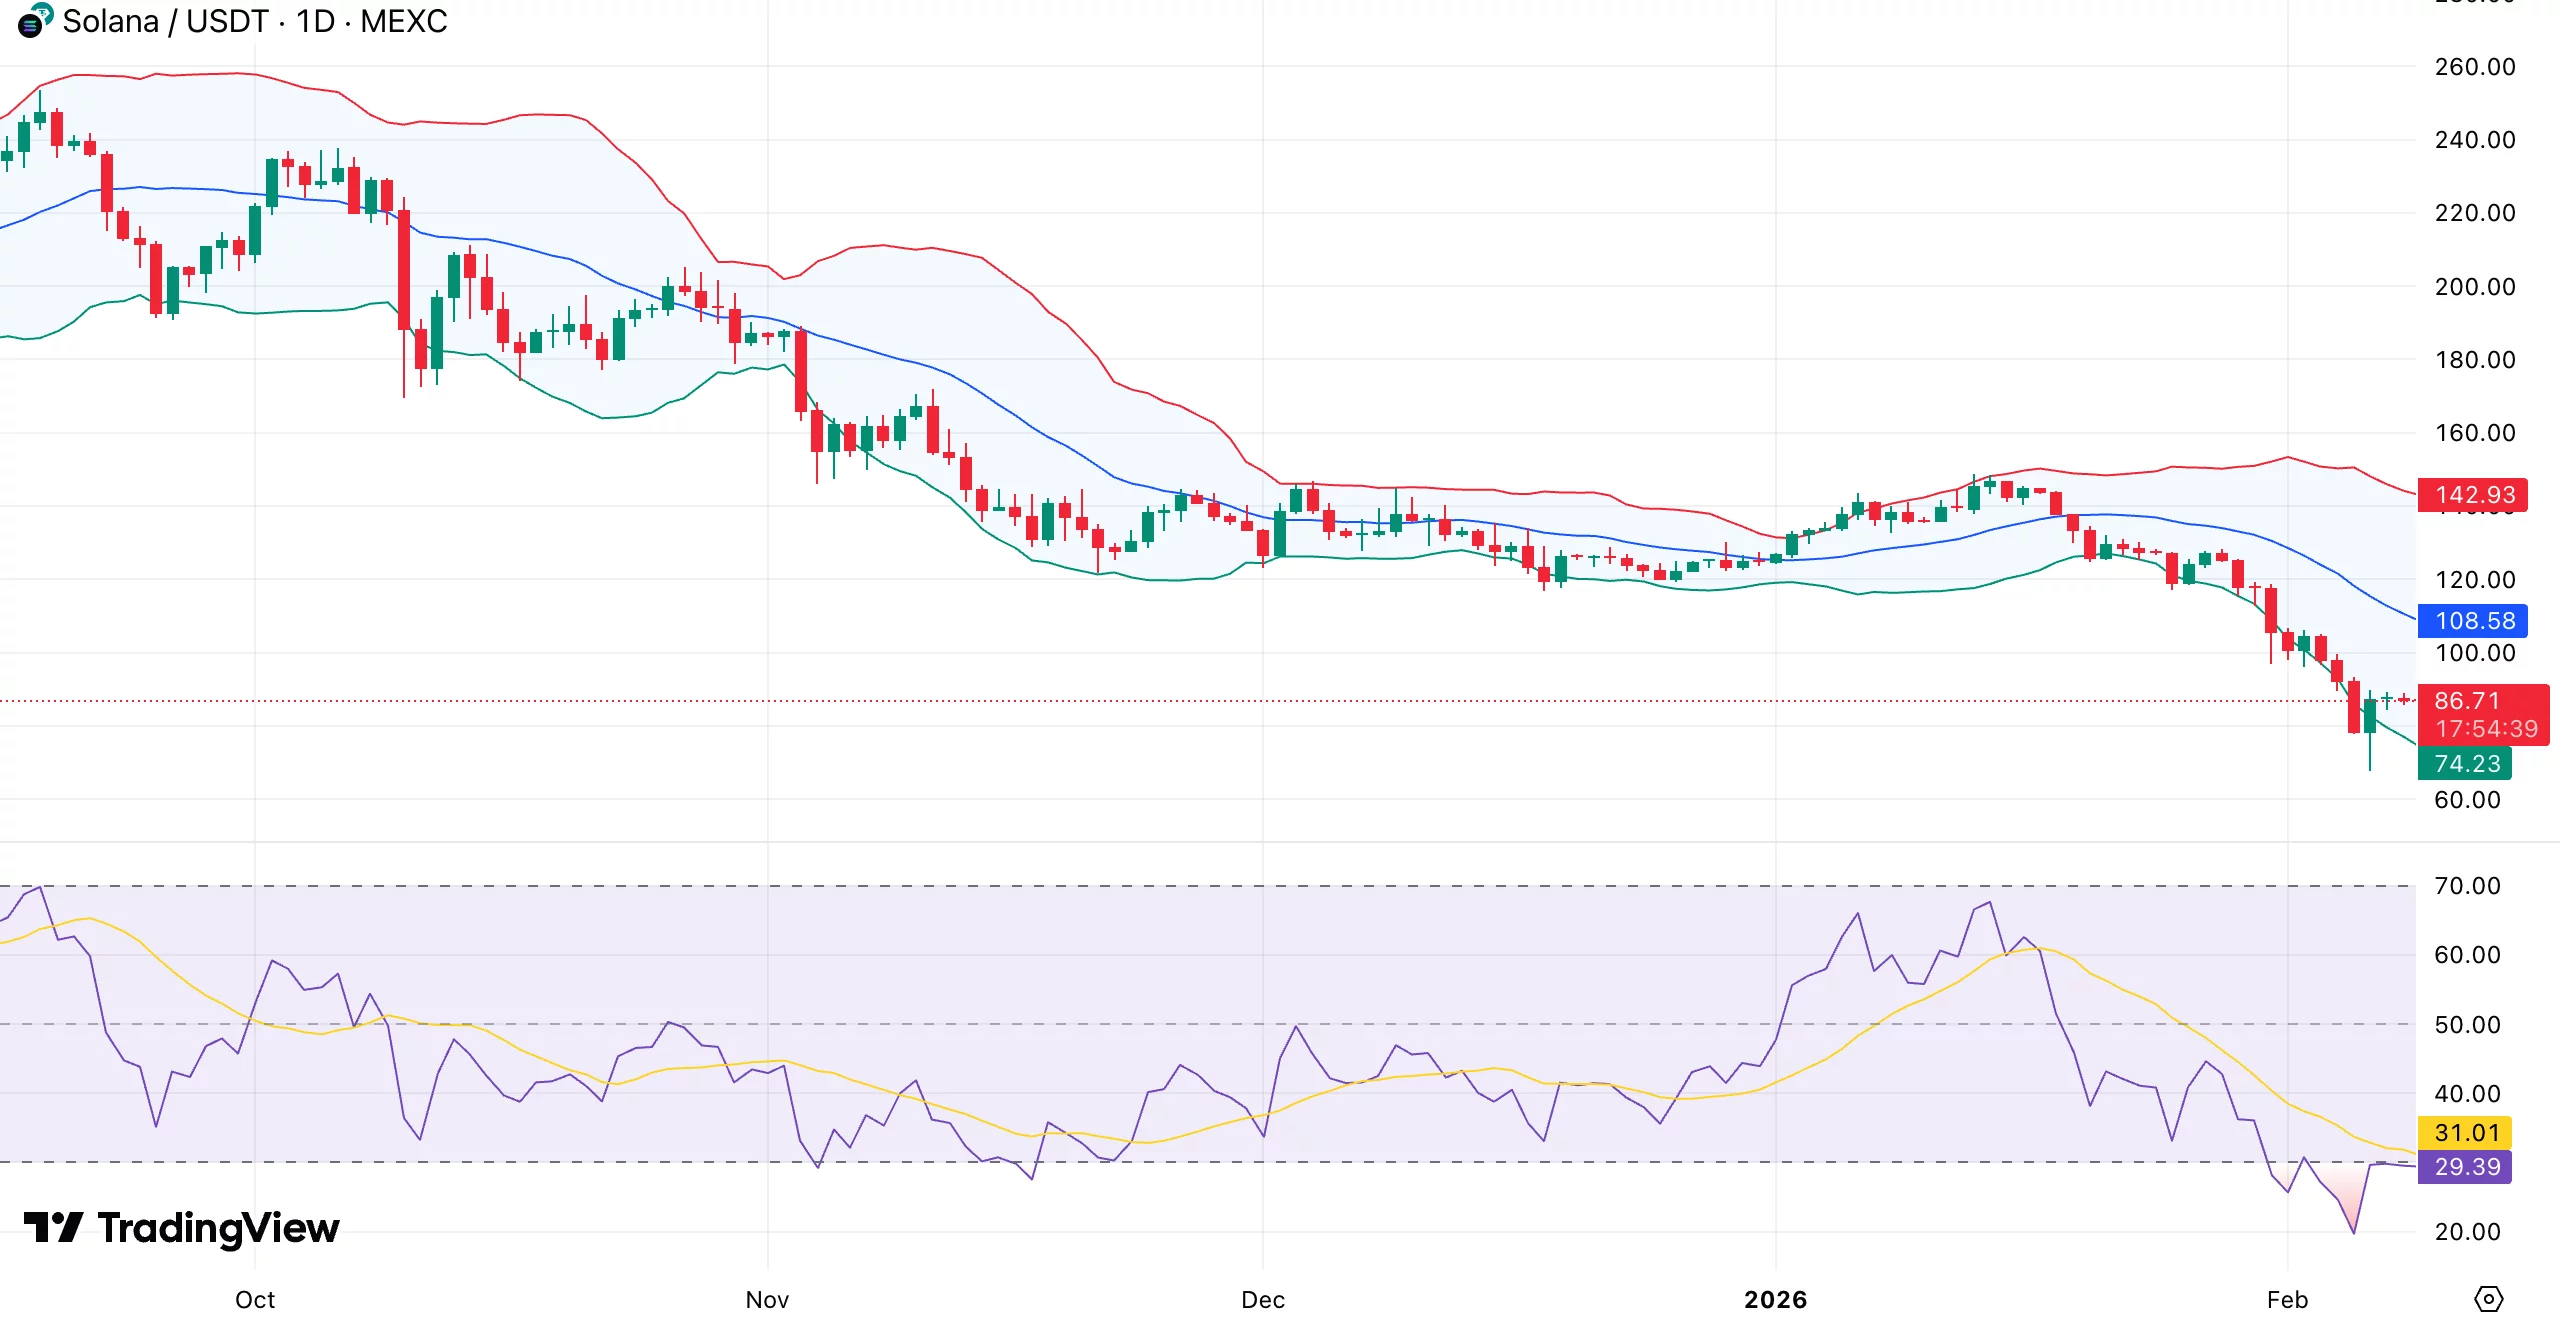
SOL is trading below both the 50-day and 100-day moving averages, which continue to slope downward. The $95–$100area has flipped into overhead supply after repeated failures, limiting recovery attempts.
Instead of a steady base, daily candles have remained near the lower Bollinger Band, indicating ongoing selling pressure.
Momentum indicators are still weak. The daily relative strength index is oversold but lacks a bullish divergence, sitting near 30. Prior dips to comparable RSI levels have produced brief recoveries, but buyers have struggled to sustain follow-through.
The $85 region is serving as short-term support and is in line with a previous demand pocket. A daily close below this level would expose the $80–$75 area next.
To ease downside pressure, Solana would need to reclaim the mid-band and hold above $100, supported by stronger volume, something the market has yet to deliver.


You May Also Like

Beyond Cleaning: What Else You Must Check Before Moving Out

Justice Department has 'gone off the rails' for Trump's 'pretzel logic': analysis


