

Analyst Says Optimism (OP) Could Deliver 4,000% Upside – Here’s How
Optimism (OP) has been through a brutal correction since its last cycle peak, but some analysts believe the project may now be entering a long-term accumulation phase.
One of them is crypto analyst Crypto Patel, who shared a chart outlining why the OP price could still have substantial upside potential despite the heavy drawdown.
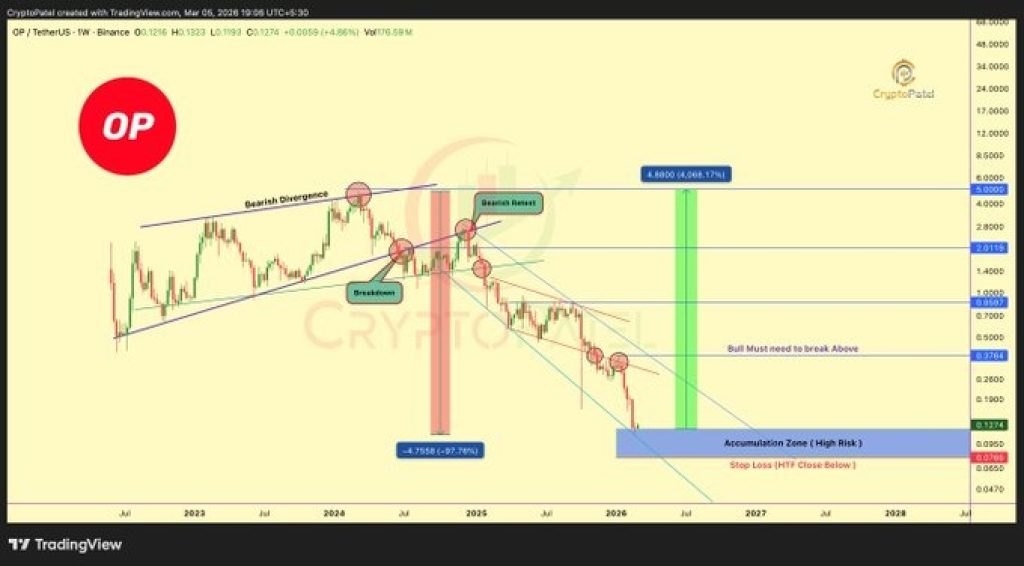
According to Patel, the token has already fallen nearly 97% from its all-time high near $5, placing it deep inside what he describes as a high-timeframe demand zone. At the moment, OP is trading around $0.12, which sits inside the $0.075–$0.13 support area highlighted on the chart.
The analyst argues that this region may represent a zone where selling pressure begins to fade and long-term buyers slowly start to accumulate positions.
Here’s What OP Chart Is Showing
Patel’s chart shows that OP has been trading inside a multi-year descending channel since its cycle high. The chart also marks a weekly bearish divergence, which appeared near the top of the market and signaled weakening momentum before the major decline started.
After that divergence formed, the price broke below the structure and later attempted a retest. That retest failed, confirming the continuation of the downtrend and pushing the token much lower.
Read Also: Here’s the Litecoin (LTC) Price If Investors Start Treating LTC as Crypto’s Digital Silver
Since then, the OP price has continued sliding down the channel while liquidity from the sell-side gradually gets absorbed. The chart now suggests that the majority of the downward move may already be close to completion.
One of the signals Patel points to is volatility compression, which often appears when a market begins stabilizing after a long decline.
 Source: X/CryptoPatel
The highlighted accumulation zone between $0.075 and $0.13 is the key level traders are watching. According to the analysis, the price is currently sitting right in the middle of that range.
Markets often form long bases after steep corrections, especially when the drawdown reaches extreme levels. A 97% decline is already considered deep by most crypto standards.
For this setup to shift from accumulation into a bullish trend, Patel says the OP price must eventually break above $0.3764 on a weekly close. That level acts as the first major structural confirmation that buyers are regaining control of the market.
Until that happens, the price may continue moving sideways as the market absorbs remaining selling pressure.
The Case for a Major Recovery For OP
While the chart focuses on technical signals, Patel also highlights several fundamental factors that could support a long-term recovery.
Optimism is one of the core infrastructures behind Ethereum’s Superchain ecosystem, which currently powers more than 34 chains and handles over half of the Layer-2 activity in the market.
The project has also attracted major institutional backing, raising more than $425 million from firms like Andreessen Horowitz and Paradigm. Its ecosystem reportedly holds around $6.3 billion in total value locked, and transaction activity continues to grow.
Patel also notes that the project runs an OP token buyback program, which uses around 50% of protocol revenue. Future upgrades such as ZK integrations and interoperability layers expected in 2026 could also expand the network’s role inside the Ethereum ecosystem.
Read Also: Hedera Gets Adopted At Central Bank Level As HBAR Superior Technology Stands Out
The Optimism Price Targets Analysts Are Watching
Based on the chart structure, Patel outlined several potential price targets if OP manages to reverse its current trend.
The first resistance levels appear around $0.37 and $0.85, followed by higher targets at $2 and eventually $5 if the market fully recovers.
A move toward $5 from the current accumulation zone would represent over 4,000% upside, which is why the analyst describes the setup as an asymmetric risk-to-reward opportunity.
However, the analysis also includes an invalidation level. If the OP price closes below $0.075 on the weekly timeframe, the structure would break and the bullish scenario would likely fail.
For now, the chart suggests that Optimism may be entering the stage where long-term investors begin paying closer attention. Whether that accumulation eventually turns into a full recovery will depend on how the market reacts around this key demand zone.
Subscribe to our YouTube channel for daily crypto updates, market insights, and expert analysis.
The post Analyst Says Optimism (OP) Could Deliver 4,000% Upside – Here’s How appeared first on CaptainAltcoin.


You May Also Like

Biographer predicts a historic end to the Trump administration

How to Spot a South African Cyber-Scam Before You Click “Pay”
Why Africa’s crypto sector is entering its ‘pay the milkman’ era


