

Index
Share
A crypto Index provides a way for investors to gain diversified exposure to a specific basket of digital assets through a single tokenized product. These indices often track specific sectors, such as DeFi, DePIN, or RWA, and are automatically rebalanced via smart contracts. In 2026, AI-managed thematic indices have become the gold standard for passive investing, allowing users to track the "blue chips" of the Web3 economy without manual portfolio management. This tag covers index methodology, rebalancing frequency, and the benefits of diversified crypto baskets.
25728 Articles
Created: 2026/02/02 18:52
Updated: 2026/02/02 18:52


Recommended by active authors

Latest Articles
Which Is The Best Crypto To Buy In This Bear Market? Remittix Tops Global Charts After Viral 300% Offer
2026/02/07 03:25
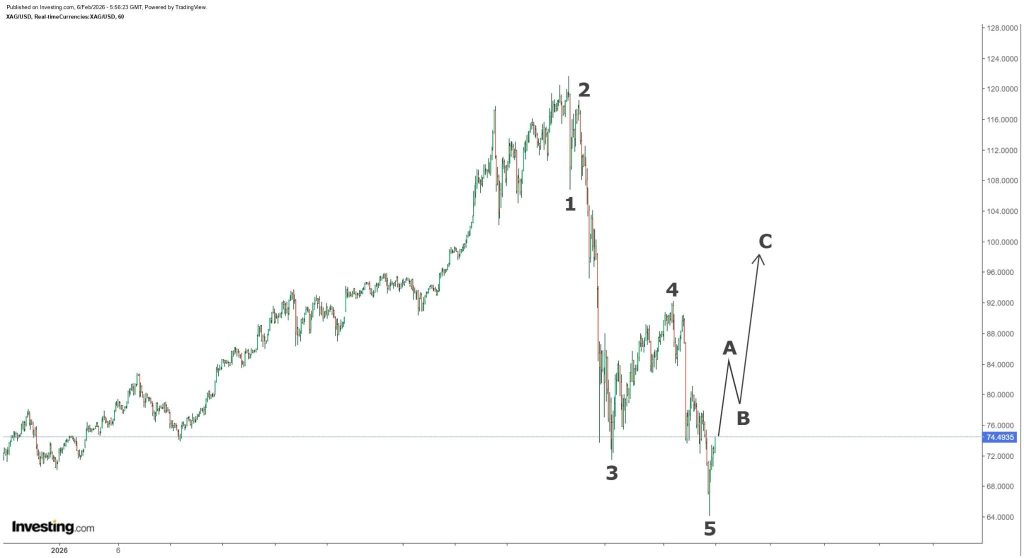
Silver Price Crash Is Over “For Real This Time,” Analyst Predicts a Surge Back Above $90
2026/02/07 03:15

The Daily: Strategy’s ok unless BTC falls to $8K, Charles Hoskinson’s down over $3B in crypto, Bithumb mistakenly sends bitcoin to users, and more
2026/02/07 03:03

Ripple CEO Hints at Buying Opportunity Amid Crashing Crypto Prices
2026/02/07 02:58

Strategy, BitMine, Coinbase Shares Chart Major Rebound as Bitcoin Stabilizes
2026/02/07 02:49