

How to Use Bollinger Bands in Trading: A Complete Beginner's Guide
Key Takeaways
- Bollinger Bands are a volatility-based technical indicator developed by John Bollinger in the 1980s. They consist of a middle band, an upper band, and a lower band.
- The standard Bollinger Bands setting uses a 20-period simple moving average with upper and lower bands positioned two standard deviations away. These parameters can be adjusted according to different trading styles.
- Bollinger Bands can help identify potential overbought and oversold conditions, volatility contractions known as squeezes, and potential shifts in trend momentum.
- Bollinger Bands should not be used alone. Combining them with indicators such as RSI and MACD may improve signal accuracy.
- Users can add Bollinger Bands to candlestick charts on MEXC and use them together with appropriate risk management when trading.
1. What Are Bollinger Bands?
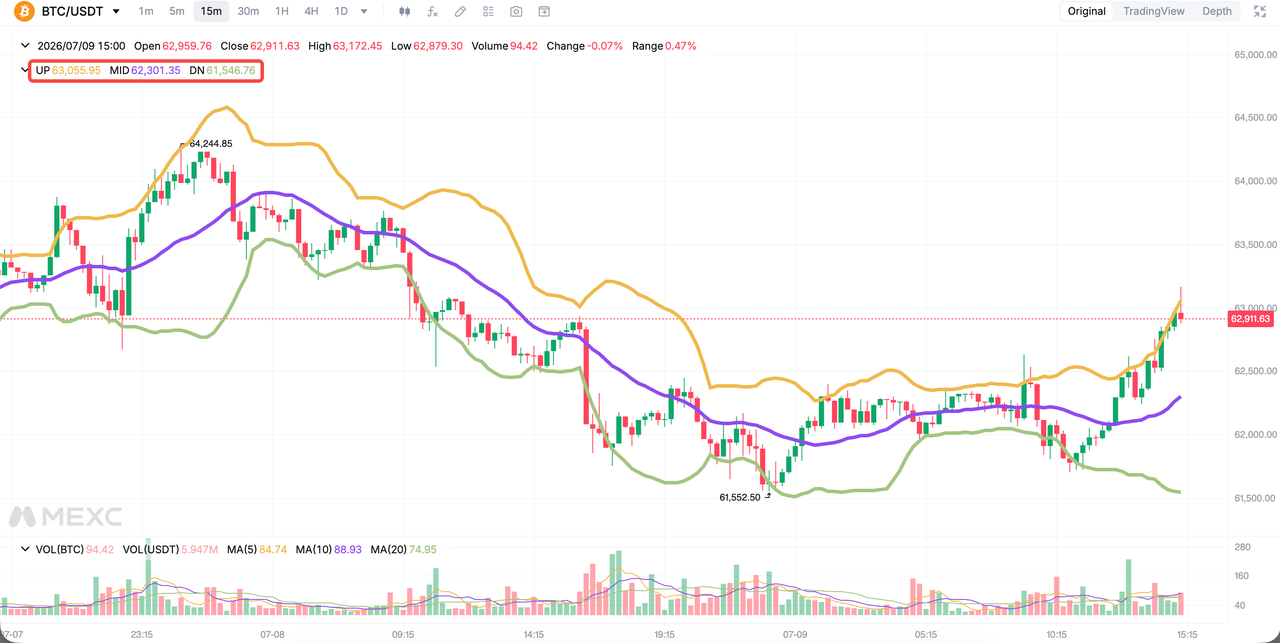
Bollinger Bands are a volatility-based technical analysis tool developed by John Bollinger in the 1980s to help traders evaluate price movements and market volatility. The indicator consists of three lines: a moving average in the middle, known as the middle band, and an upper band and lower band positioned a certain number of standard deviations above and below it.
The core principle of Bollinger Bands is to assess whether the current price is relatively high or low based on its position within the three bands. The distance between the bands also provides a visual indication of market volatility. Wider bands indicate increasing volatility, while narrower bands indicate decreasing volatility. Bollinger Bands are available as a built-in indicator on both Spot and Futures trading charts on MEXC.
2. Components and Calculation of Bollinger Bands
Bollinger Bands consist of three components:
Middle band: Usually a 20-period simple moving average, calculated by adding the closing prices from the most recent 20 periods and dividing the total by 20. It serves as the baseline for price movements.
Upper band: The middle band plus two standard deviations, forming the upper volatility band.
Lower band: The middle band minus two standard deviations, forming the lower volatility band.
Because standard deviation automatically adjusts as price volatility changes, Bollinger Bands can adapt dynamically to different market conditions. This is their main advantage over fixed-channel indicators.
3. How to Trade With Bollinger Bands: Three Core Uses
3.1 Identify volatility squeezes and monitor breakouts
When the upper and lower bands narrow significantly and move closer together, this is known as a Bollinger Band squeeze. It indicates that market volatility is relatively low.
Periods of unusually low volatility are often followed by renewed volatility. Traders may wait for the price to break out of the squeeze. A break above the upper band may provide a potential long entry, while a break below the lower band may provide a potential short entry.
A stop-loss may be placed on the opposite side of the breakout pattern.
3.2 Identify overbought and oversold conditions
When the price touches or moves above the upper band, it may indicate short-term overbought conditions. When the price touches or falls below the lower band, it may indicate short-term oversold conditions.
In sideways markets, the price often moves between the upper and lower bands and returns toward the middle band. Traders may therefore look for potential buying opportunities near the lower band and selling opportunities near the upper band.
However, John Bollinger has emphasized that touching a band does not constitute a trading signal by itself. During a strong trend, the price may continue moving along the upper or lower band, a pattern commonly known as "walking the bands."
Trading against the trend under these conditions can carry significant risk. Traders should wait for additional confirmation signals before entering a position.
3.3 Confirm trend direction and potential trend endings
During an uptrend, the price usually remains above the middle band, which may act as dynamic support. During a downtrend, the price generally remains below the middle band, which may act as dynamic resistance.
At the beginning of a strong trend, the upper and lower bands often expand in opposite directions. When the band on the opposite side of the trend begins to turn and narrow again, it may indicate that the current trend is losing momentum or approaching an end.
4. Indicators to Use With Bollinger Bands
Bollinger Bands are based entirely on price data and may generate false signals when used alone. Traders may combine them with the following tools for confirmation:
- Relative Strength Index (RSI): Helps confirm overbought and oversold conditions and filter out false reversal signals.
- Moving Average Convergence Divergence (MACD): Tracks momentum changes and helps confirm trend direction.
- Volume indicators: Help verify whether a breakout is supported by sufficient trading activity. Breakouts with low volume are more likely to be false.
5. Risk Management Tips for Using Bollinger Bands on MEXC
Regardless of the indicator used, risk management remains essential to trading. When using Bollinger Bands on MEXC, traders should consider the following:
- Set stop-loss orders appropriately. A stop-loss for a long position may be placed below the lower band, while a stop-loss for a short position may be placed above the upper band.
- Adjust position size according to the width of the bands. The greater the volatility, the smaller the position should generally be.
- Avoid trading too frequently during periods of low volatility.
- Remember that technical analysis is based on historical data and cannot guarantee future results. No indicator can ensure profits.
6. Bollinger Bands FAQ
6.1 How can I use Bollinger Bands effectively?
Bollinger Bands can be used to identify volatility squeezes, overbought and oversold areas, and trend direction.
Signals should be confirmed with tools such as the Relative Strength Index. Traders should not enter a position solely because the price touches one of the bands.
6.2 What are the best Bollinger Bands settings?
The standard setting is a 20-period moving average with bands positioned two standard deviations away. This setting is suitable for most trading scenarios.
Short-term traders may use a 10-period setting with 1.5 standard deviations, while longer-term traders may use a 50-period setting with 2.5 standard deviations.
6.3 Which timeframes are suitable for Bollinger Bands?
Bollinger Bands can be used on any timeframe.
Day traders commonly use charts ranging from five minutes to one hour, while swing traders often use four-hour and daily charts. Signals on longer timeframes are generally considered more reliable.
6.4 Are Bollinger Bands a good indicator?
Bollinger Bands are among the most widely used volatility indicators because they are intuitive and adapt to changing market conditions.
However, they are not a complete trading system and should be used together with other indicators and appropriate risk management.
6.5 What is a Bollinger Bands day trading strategy?
A common approach in a sideways market is to buy near the lower band and sell near the upper band.
Another approach is to enter in the direction of a breakout after a Bollinger Band squeeze, using the middle band or the opposite band as a potential target.
6.6 What are the best indicators to use with Bollinger Bands?
The Relative Strength Index, Moving Average Convergence Divergence, and volume indicators are commonly used with Bollinger Bands to help filter out false signals.
6.7 How do I set up Bollinger Bands on MEXC?
Go to the MEXC Spot or Futures trading page, open the candlestick chart, and click Indicators. Search for and add Bollinger Bands, then customize the period and standard deviation settings as needed.
Recommended Reading:
Risk Warning: Technical indicators are based on historical data and do not guarantee future performance. Digital assets are highly volatile. Trade cautiously based on your risk tolerance and avoid blindly following market trends.