Buy Crypto
Markets
Spot
FuturesBTC
Earn
Event Center
Rewards Hub
More
How to Use ENE in U.S. Stock Trading: A Complete Beginner's GuideHow to Use ENE in U.S. Stock Trading: A Complete Beginner's Guide
Category List
Cancel

How to Use ENE in U.S. Stock Trading: A Complete Beginner's Guide

Key Takeaways:

  • Channel Line or "Entering and Exiting"(ENE) consists of three lines: a middle band, an upper band, and a lower band. It helps identify when price may be extended above or below its moving average.
  • The conventional default settings for ENE are (25, 11, 11), which can be adjusted to suit the volatility of different U.S. stocks.
  • Range-bound markets suit mean-reversion strategies that aim to sell high and buy low, while trending markets call for trend-following breakout strategies.
  • ENE is best used alongside tools such as the Relative Strength Index (RSI) and Moving Average Convergence Divergence (MACD) to help improve signal accuracy.

1. What Is ENE?


ENE, also known as a channel, trading envelope, or Envelope indicator, is a channel-based technical analysis tool commonly used in U.S. stock trading. It is based on the idea that prices fluctuate around their average and may encounter resistance after an extended rise or find support after an extended decline.

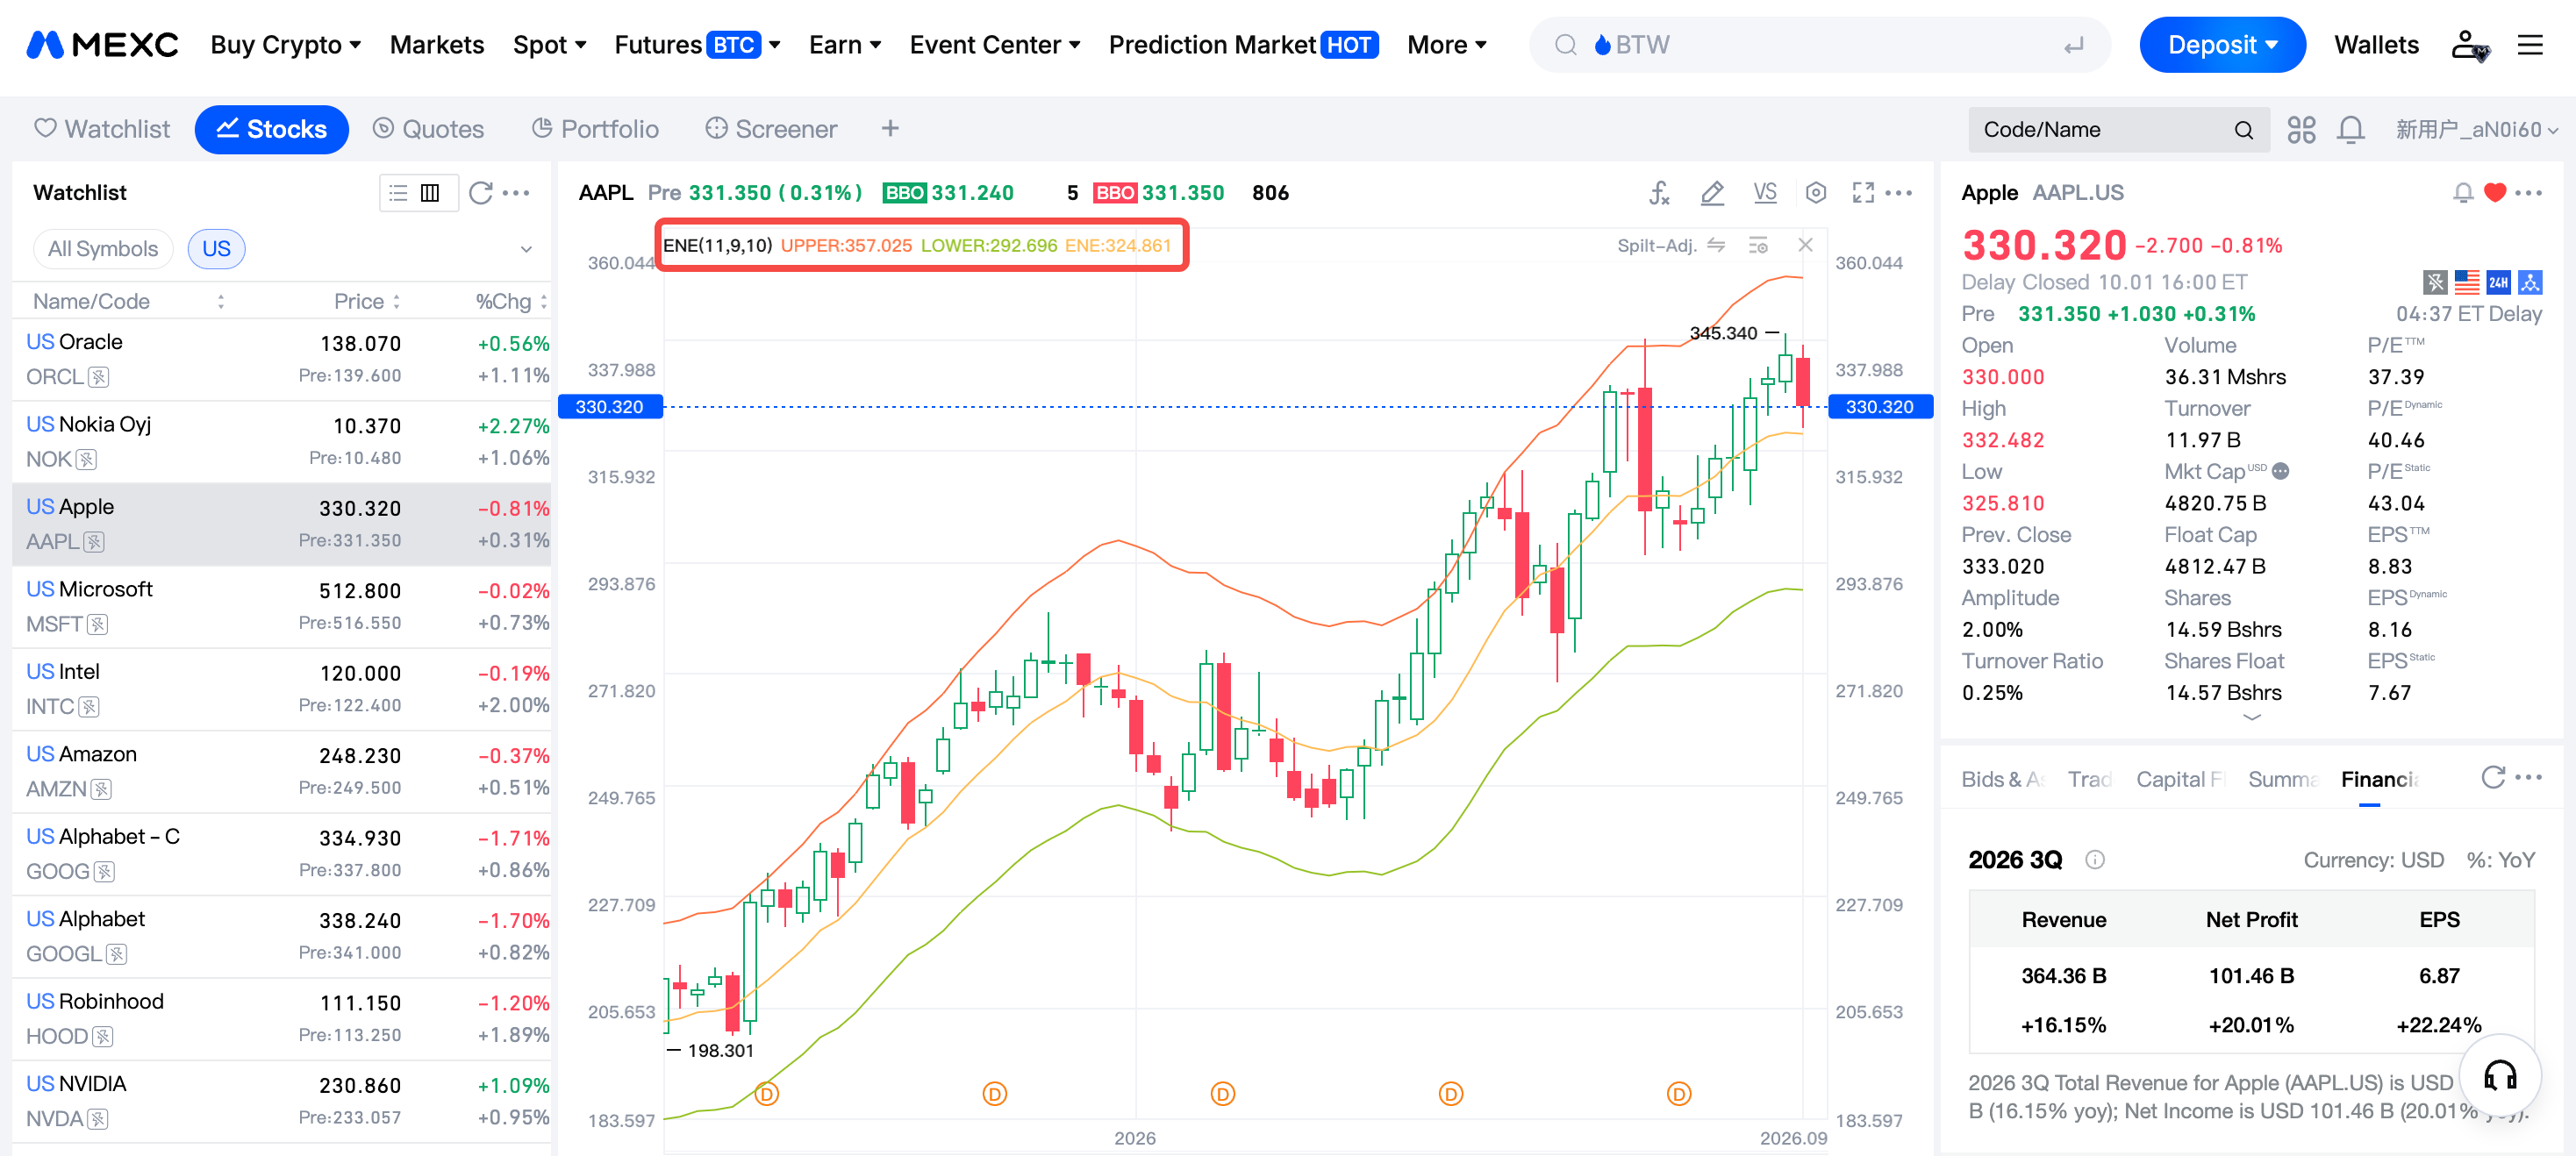
The indicator consists of three lines that follow the same general direction on a candlestick chart. The middle band is typically a simple moving average over a specified period, providing a central reference for price action. The upper band is set a fixed percentage above the middle band and provides a reference for potential resistance, while the lower band is set the same percentage below it and provides a reference for potential support. Together, the lines form a channel intended to contain much of the price action.

2. ENE Parameter Settings


The effectiveness of ENE depends heavily on the combination of the moving average period and percentage offsets. Volatility varies considerably across U.S. stocks, so settings need to be tailored to the asset.

  • The conventional default settings are (25, 11, 11): a 25-day moving average with the upper and lower bands each set 11% away from it. These settings suit most medium-term swing trades.
  • For short-term trading or highly volatile stocks, such as technology growth stocks, the period can be shortened to around 10 and the offsets reduced to 6% to 9% to increase sensitivity.
  • For long-term investing or low-volatility blue-chip stocks, the period can be extended to 30 and the offsets increased to more than 12% to filter out market noise.

Shorter periods generate more signals but are also more sensitive to market noise. Smaller percentage offsets create a narrower channel and more frequent signals, while larger offsets create a wider channel with fewer signals and may help filter out market noise. Backtest the settings using historical data before applying them to live trading.

3. ENE Trading Strategies


3.1 Range-bound markets: Sell high and buy low with mean reversion


When the market has no clear trend and the three bands move sideways, price tends to fluctuate within the channel. A decline that touches or falls below the lower band shows that price has moved relatively far below its moving average. In this range-bound context, traders may interpret the move as a potential buying opportunity if price reverts toward the middle band. Similarly, a rise that touches or breaks above the upper band shows that price has moved relatively far above its moving average, which traders may use as a reference for a potential sell or take-profit opportunity if price pulls back.


When the market moves strongly in one direction and the bands slope clearly upward or downward, trading blindly against the trend carries substantial risk. The approach should shift to following the trend. In an uptrend, a strong breakout that holds above the upper band signals a surge in bullish momentum. Traders may hold their shares or add to positions in line with the trend rather than rush to sell. In a downtrend, if price breaks below the lower band and the channel continues to slope downward, traders should stay on the sidelines or cut losses promptly instead of blindly trying to pick a bottom.

The middle band is also an important dividing line for buy and sell signals. A break above it provides a potential short-term buy signal, while a break below it provides a potential short-term sell signal. A noticeable narrowing of the channel often suggests an approaching change in price behavior. At such times, closely watch for changes in the direction of the middle band.

4. How to Improve ENE Signal Accuracy


Any single indicator can be affected by market noise, so ENE should be combined with other tools:

  • RSI can provide additional context when assessing potential overbought or oversold conditions. When price touches the upper band and RSI is above 70, the RSI reading may support a potential sell signal.
  • MACD can help assess trend momentum. When its crossover signals align with ENE signals, they may provide additional confirmation for a trade.
  • Trading volume helps assess whether a breakout has supporting participation. Rising volume can lend support to a break above the upper band, while a move on declining volume warrants caution because it may reflect market noise rather than a sustained breakout.

For risk management, set a stop-loss order for every trade to limit potential losses. Size positions according to signal strength and your risk tolerance, and avoid committing too much capital to a single trade.

5. How to Add ENE to U.S. Stock Charts on MEXC


The U.S. stock trading feature on MEXC supports adding and configuring ENE. Follow these simple steps:

1) Log in to your account, go to the U.S. stock trading page, and open the price chart for your chosen stock.

2) Click the indicator button above the chart, then search for and select ENE in the indicator list.

3) Once the indicator is added, you can adjust its period parameters to suit your trading preferences, and the system will automatically plot three lines on the chart. Beginners are advised to start with the default settings and observe the indicator on a daily chart before making personalized adjustments after becoming familiar with how it works.


6. ENE FAQ


6.1 What is the ENE indicator?


ENE is a technical analysis tool consisting of a moving average and two lines set a fixed percentage above and below it. It helps assess how far price has moved from its moving average and provides references for potential support and resistance.

6.2 How do I use ENE for trading?


In range-bound markets, traders may consider buying when price touches the lower band and selling when it touches the upper band. In trending markets, a break above the upper band on rising volume may support holding a position in line with the trend, while a break below the lower band calls for cutting losses and staying on the sidelines. Also use the direction of the middle band to assess the overall trend.

6.3 What are the best ENE settings?


The conventional default settings are (25, 11, 11). Short-term trades or highly volatile assets may use a period of 10 with offsets of 6% to 9%, while long-term trades or low-volatility assets may use a period of 30 with offsets above 12%. The most suitable settings should be determined through backtesting on the specific asset.

6.4 How do ENE trading strategies work?


The core approach combines mean reversion with trend following: buy low and sell high when price oscillates within the channel, and trade breakouts in the direction of the trend when the channel slopes upward or downward. Use stop-loss orders and position sizing to manage risk.

6.5 How does ENE differ from Bollinger Bands?


ENE uses fixed percentage offsets, keeping its width stable relative to the moving average. Bollinger Bands are calculated using standard deviation and automatically expand or contract with volatility. ENE is simpler and more straightforward, while Bollinger Bands adapt more readily to changes in market volatility.

6.6 Which markets and timeframes are suitable for ENE?


ENE can be used across markets, including U.S. stocks, forex, and crypto assets, and on timeframes ranging from minute charts to daily charts. It can be easier to interpret when price trends are clear, while market noise can make signals harder to interpret in sideways, range-bound conditions.

How to Use ENE in U.S. Stock Trading: A Complete Beginner's Guide

Key Takeaways:

  • Channel Line or "Entering and Exiting"(ENE) consists of three lines: a middle band, an upper band, and a lower band. It helps identify when price may be extended above or below its moving average.
  • The conventional default settings for ENE are (25, 11, 11), which can be adjusted to suit the volatility of different U.S. stocks.
  • Range-bound markets suit mean-reversion strategies that aim to sell high and buy low, while trending markets call for trend-following breakout strategies.
  • ENE is best used alongside tools such as the Relative Strength Index (RSI) and Moving Average Convergence Divergence (MACD) to help improve signal accuracy.

1. What Is ENE?


ENE, also known as a channel, trading envelope, or Envelope indicator, is a channel-based technical analysis tool commonly used in U.S. stock trading. It is based on the idea that prices fluctuate around their average and may encounter resistance after an extended rise or find support after an extended decline.

The indicator consists of three lines that follow the same general direction on a candlestick chart. The middle band is typically a simple moving average over a specified period, providing a central reference for price action. The upper band is set a fixed percentage above the middle band and provides a reference for potential resistance, while the lower band is set the same percentage below it and provides a reference for potential support. Together, the lines form a channel intended to contain much of the price action.


2. ENE Parameter Settings


The effectiveness of ENE depends heavily on the combination of the moving average period and percentage offsets. Volatility varies considerably across U.S. stocks, so settings need to be tailored to the asset.

  • The conventional default settings are (25, 11, 11): a 25-day moving average with the upper and lower bands each set 11% away from it. These settings suit most medium-term swing trades.
  • For short-term trading or highly volatile stocks, such as technology growth stocks, the period can be shortened to around 10 and the offsets reduced to 6% to 9% to increase sensitivity.
  • For long-term investing or low-volatility blue-chip stocks, the period can be extended to 30 and the offsets increased to more than 12% to filter out market noise.

Shorter periods generate more signals but are also more sensitive to market noise. Smaller percentage offsets create a narrower channel and more frequent signals, while larger offsets create a wider channel with fewer signals and may help filter out market noise. Backtest the settings using historical data before applying them to live trading.

3. ENE Trading Strategies


3.1 Range-bound markets: Sell high and buy low with mean reversion


When the market has no clear trend and the three bands move sideways, price tends to fluctuate within the channel. A decline that touches or falls below the lower band shows that price has moved relatively far below its moving average. In this range-bound context, traders may interpret the move as a potential buying opportunity if price reverts toward the middle band. Similarly, a rise that touches or breaks above the upper band shows that price has moved relatively far above its moving average, which traders may use as a reference for a potential sell or take-profit opportunity if price pulls back.


When the market moves strongly in one direction and the bands slope clearly upward or downward, trading blindly against the trend carries substantial risk. The approach should shift to following the trend. In an uptrend, a strong breakout that holds above the upper band signals a surge in bullish momentum. Traders may hold their shares or add to positions in line with the trend rather than rush to sell. In a downtrend, if price breaks below the lower band and the channel continues to slope downward, traders should stay on the sidelines or cut losses promptly instead of blindly trying to pick a bottom.

The middle band is also an important dividing line for buy and sell signals. A break above it provides a potential short-term buy signal, while a break below it provides a potential short-term sell signal. A noticeable narrowing of the channel often suggests an approaching change in price behavior. At such times, closely watch for changes in the direction of the middle band.

4. How to Improve ENE Signal Accuracy


Any single indicator can be affected by market noise, so ENE should be combined with other tools:

  • RSI can provide additional context when assessing potential overbought or oversold conditions. When price touches the upper band and RSI is above 70, the RSI reading may support a potential sell signal.
  • MACD can help assess trend momentum. When its crossover signals align with ENE signals, they may provide additional confirmation for a trade.
  • Trading volume helps assess whether a breakout has supporting participation. Rising volume can lend support to a break above the upper band, while a move on declining volume warrants caution because it may reflect market noise rather than a sustained breakout.

For risk management, set a stop-loss order for every trade to limit potential losses. Size positions according to signal strength and your risk tolerance, and avoid committing too much capital to a single trade.

5. How to Add ENE to U.S. Stock Charts on MEXC


The U.S. stock trading feature on MEXC supports adding and configuring ENE. Follow these simple steps:

1) Log in to your account, go to the U.S. stock trading page, and open the price chart for your chosen stock.

2) Click the indicator button above the chart, then search for and select ENE in the indicator list.

3) Once the indicator is added, you can adjust its period parameters to suit your trading preferences, and the system will automatically plot three lines on the chart. Beginners are advised to start with the default settings and observe the indicator on a daily chart before making personalized adjustments after becoming familiar with how it works.


6. ENE FAQ


6.1 What is the ENE indicator?


ENE is a technical analysis tool consisting of a moving average and two lines set a fixed percentage above and below it. It helps assess how far price has moved from its moving average and provides references for potential support and resistance.

6.2 How do I use ENE for trading?


In range-bound markets, traders may consider buying when price touches the lower band and selling when it touches the upper band. In trending markets, a break above the upper band on rising volume may support holding a position in line with the trend, while a break below the lower band calls for cutting losses and staying on the sidelines. Also use the direction of the middle band to assess the overall trend.

6.3 What are the best ENE settings?


The conventional default settings are (25, 11, 11). Short-term trades or highly volatile assets may use a period of 10 with offsets of 6% to 9%, while long-term trades or low-volatility assets may use a period of 30 with offsets above 12%. The most suitable settings should be determined through backtesting on the specific asset.

6.4 How do ENE trading strategies work?


The core approach combines mean reversion with trend following: buy low and sell high when price oscillates within the channel, and trade breakouts in the direction of the trend when the channel slopes upward or downward. Use stop-loss orders and position sizing to manage risk.

6.5 How does ENE differ from Bollinger Bands?


ENE uses fixed percentage offsets, keeping its width stable relative to the moving average. Bollinger Bands are calculated using standard deviation and automatically expand or contract with volatility. ENE is simpler and more straightforward, while Bollinger Bands adapt more readily to changes in market volatility.

6.6 Which markets and timeframes are suitable for ENE?


ENE can be used across markets, including U.S. stocks, forex, and crypto assets, and on timeframes ranging from minute charts to daily charts. It can be easier to interpret when price trends are clear, while market noise can make signals harder to interpret in sideways, range-bound conditions.