

How to Use the BRAR Indicator in Trading: A Complete Beginner's Guide
Key Takeaways
- The BRAR indicator consists of two curves: the Popularity Index (AR) and the Willingness Index (BR), which measure market activity and buying or selling sentiment.
- AR values between 80 and 120 generally indicate a consolidation range. A reading above 150 may signal overbought conditions and potential pullbacks, while a reading below 50 may indicate possible rebound opportunities.
- BR values between 70 and 150 are considered a normal range. A reading above 300 may indicate strong selling pressure ahead, while a reading below 50 may suggest that a market bottom could be approaching.
- AR and BR should be analyzed together. Traders can identify potential tops when both indicators rise and reverse sharply, identify potential bottoms when BR falls below AR, and detect potentially weak rallies driven by excessive short-term sentiment.
- MEXC users can access the BRAR indicator directly from charting tools and combine it with trend indicators and risk management strategies to support spot and futures trading.
1. What Is the BRAR Indicator?
The BRAR indicator, also known as the Emotion Index and Willingness Index, is a technical analysis tool composed of two independent indicators: the Popularity Index (AR) and the Willingness Index (BR).
By analyzing historical price data, BRAR evaluates market psychology from two different perspectives. The AR indicator focuses on market activity during the current trading period, while the BR indicator reflects the buying and selling sentiment relative to the previous closing price.
For cryptocurrency traders, market sentiment is often a key driver behind sharp price movements. On MEXC charts, users can apply sentiment-based indicators like BRAR to better evaluate potential trading opportunities.
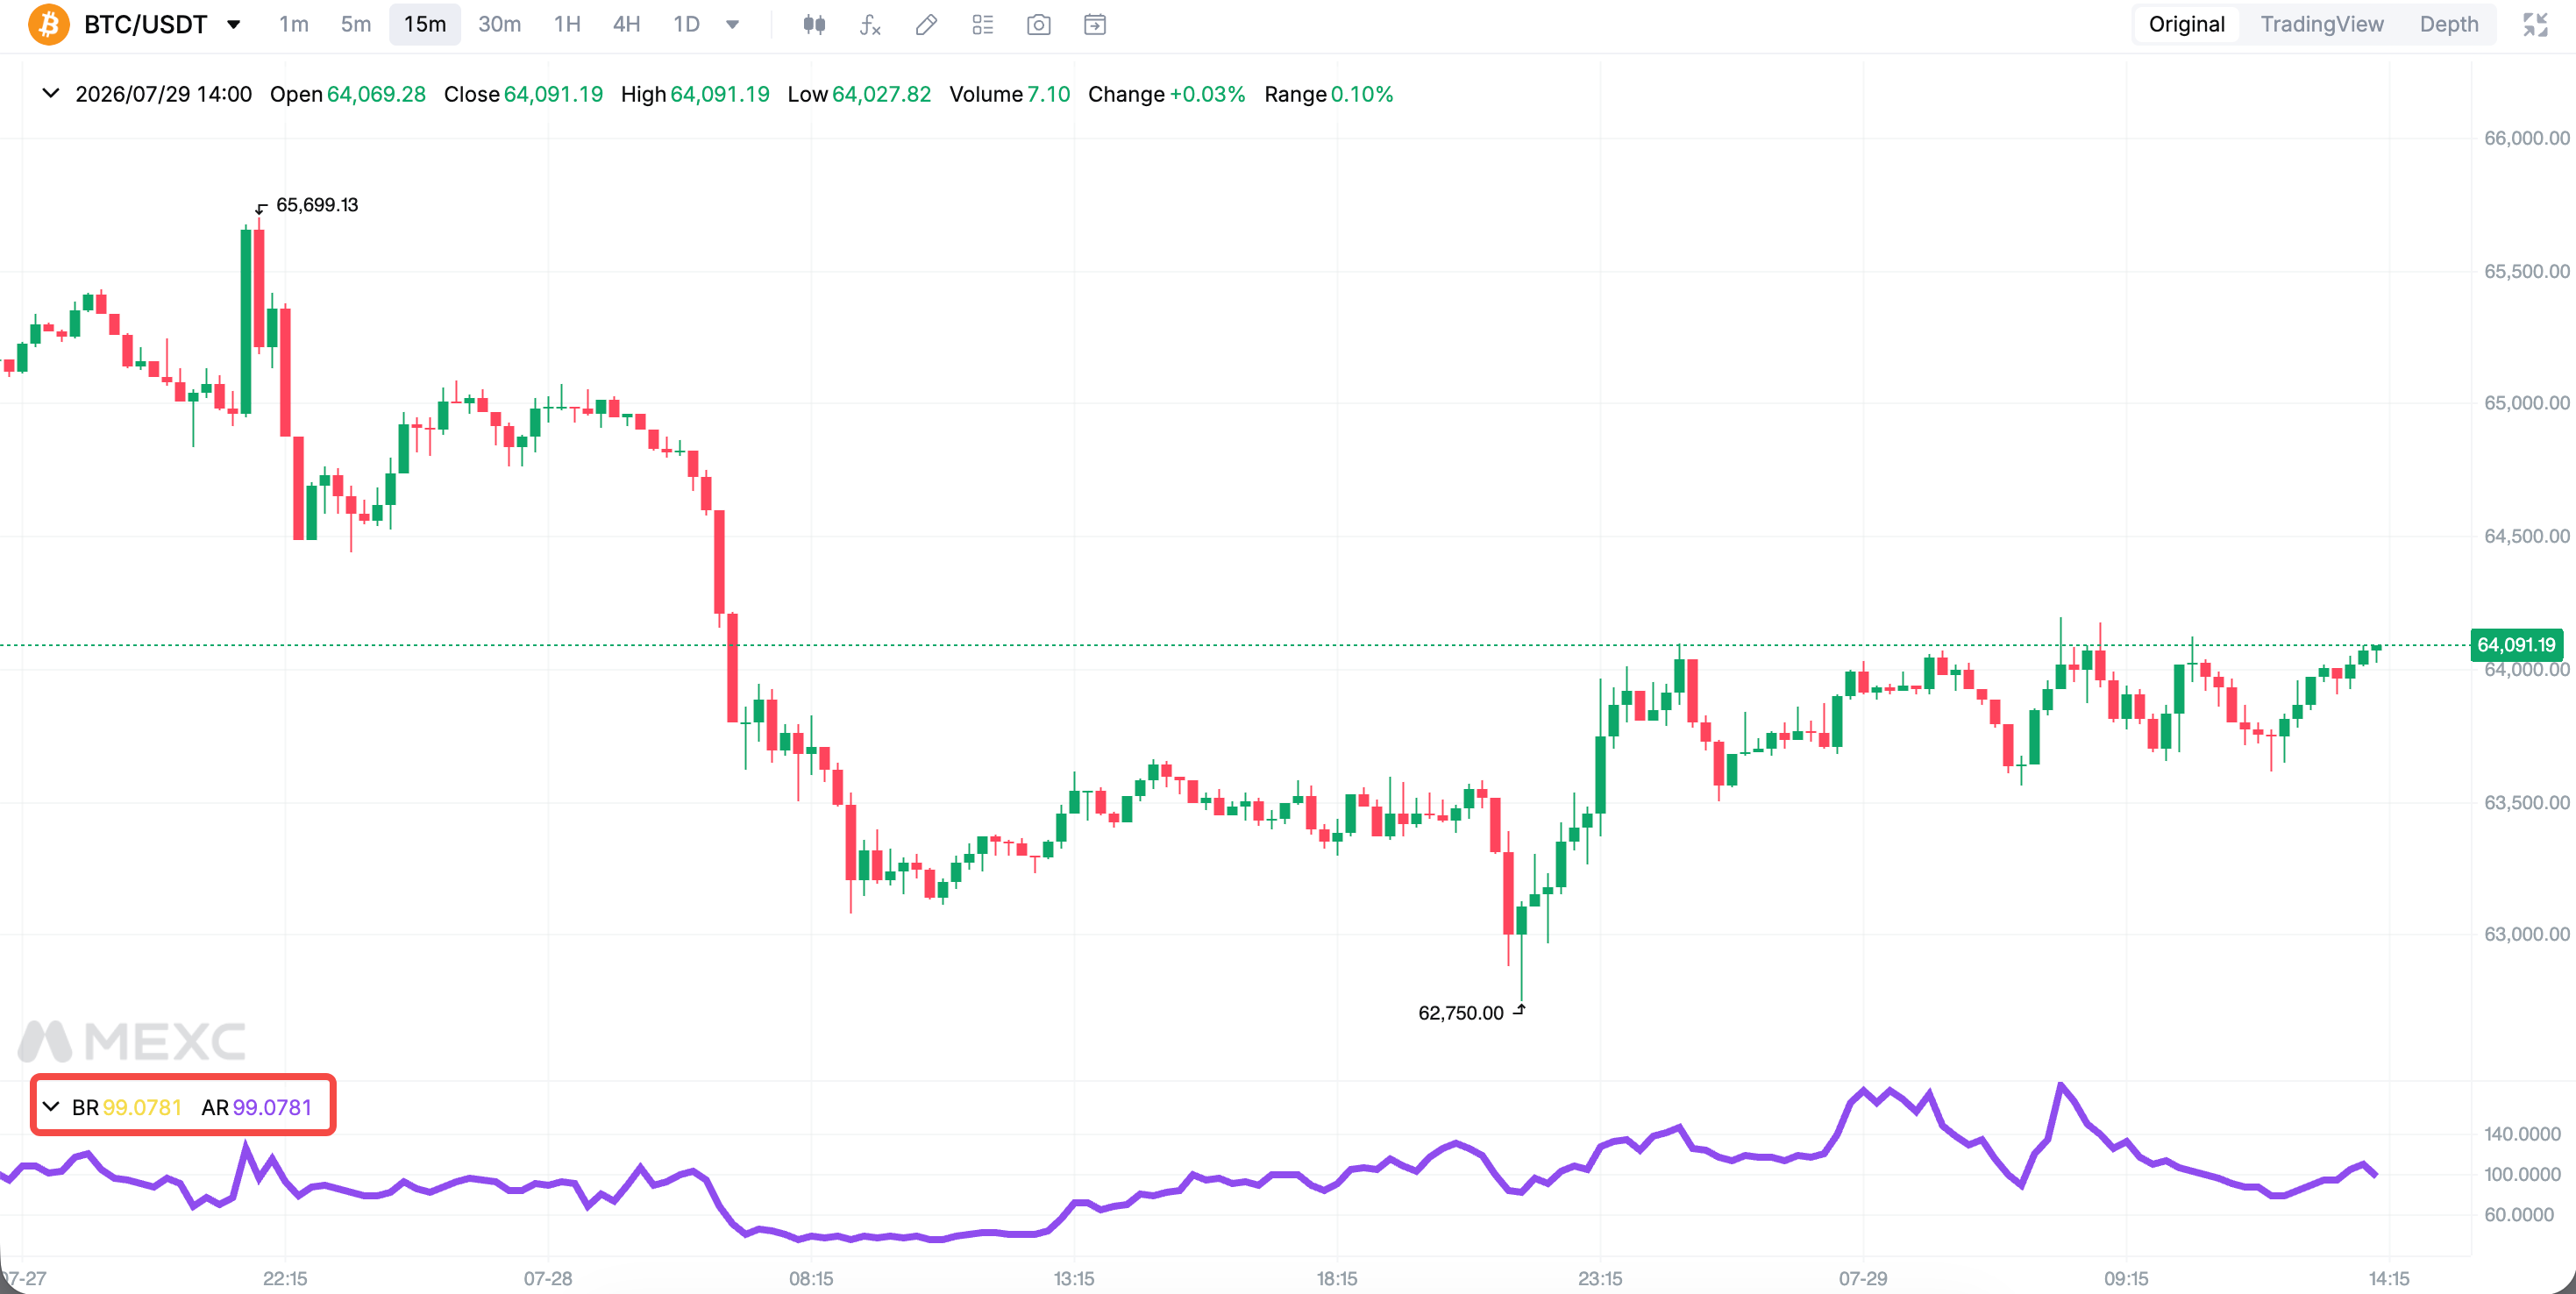
2. How to Interpret the BRAR Indicator
2.1 How to Read the Popularity Index (AR)
- AR between 80 and 120: The market is usually in a consolidation phase, with relatively stable price movements and limited volatility.
- AR above 150: Market activity may be overheated. Prices may have entered a relatively high zone, increasing the possibility of a pullback.
- AR below 50: Market sentiment may be weakening, and prices may be approaching a potential bottom area where rebounds may occur.
AR usually moves in the same direction as price trends. When AR rises, market momentum often strengthens; when AR declines, market sentiment may weaken. In addition, AR can sometimes provide early warning signals of potential market tops or bottoms.
2.2 How to Read the Willingness Index (BR)
- BR between 70 and 150: The market is within a normal range, suggesting balanced buying and selling activity.
- BR above 300: Buying enthusiasm may have become excessive, creating a stronger warning signal for a possible pullback.
- BR below 50: Buying interest may have weakened significantly, indicating extreme pessimism and a possible bottoming area.
BR tends to fluctuate more sharply than AR, but using BR alone may generate unreliable signals. Traders should combine BR with AR to provide additional confirmation.
3. BRAR Trading Strategies
1) Identifying Potential Tops
When both AR and BR rise sharply and then reverse downward quickly, it may indicate that prices are approaching a peak and bullish momentum is weakening. Traders should consider taking profits or reducing exposure.
2) Identifying False Market Strength
When BR rises rapidly while AR only increases slightly or remains flat, it may indicate that short-term sentiment has exceeded actual market participation. This may represent a fragile rally, where traders should be cautious about chasing prices higher.
3) Spotting Potential Bottoms
Under normal conditions, BR is usually higher than AR. When BR falls below AR while both indicators are at relatively low levels, it may suggest that market sentiment has been sufficiently cleared out, creating a potential buying opportunity.
4) Combining BRAR With Other Indicators
BRAR is mainly a timing tool and should not be used as a standalone trading signal. Traders can combine it with trend indicators such as moving averages to filter signals.
Before trading Spot or Futures on MEXC, users can test strategies through simulated trading and apply proper risk management before committing real funds.
4. Practical Tips for Using BRAR on MEXC
When applying the BRAR indicator on MEXC charts, consider the following:
- Parameter Settings: The default BRAR period is 26. Short-term traders may shorten the period to make the indicator respond faster.
- Timeframe Selection: Daily chart signals may contain less short-term noise than minute-level signals and are more suitable for medium-term trading strategies.
- Risk Management: Bottom signals may sometimes be clearer than top signals because strong market trends can remain overbought for extended periods. Avoid opening short positions solely because BR reaches a high level.
5. BRAR FAQ
5.1 What is the market strength indicator, and how is it used?
The market strength indicator measures the relative strength between buyers and sellers. The BRAR indicator is one type of market sentiment analysis tool. Higher values may indicate stronger buying interest, while lower values may suggest weaker market sentiment. Extreme readings may signal potential reversal risks.
5.2 What do the input parameters mean?
Input parameters refer to the variables used in indicator calculations, such as the BRAR calculation period. The default period is 26.
A shorter period makes the indicator more sensitive to price changes, while a longer period produces smoother signals.
5.3 Why does BR usually fluctuate more than AR?
BR uses the previous closing price as a reference and reflects changes relative to the previous close, making it more sensitive to price gaps and emotional shifts. As a result, BR generally has larger fluctuations than AR.
5.4 How to use BRAR on MEXC?
Go to MEXC official website → Spot/Futures → Indicators → BRAR
5.5 Is BRAR suitable for cryptocurrency trading?
Yes. Cryptocurrency markets are strongly influenced by market sentiment, making sentiment-based indicators useful references.
However, crypto markets operate 24/7 and experience high volatility. When using BRAR on MEXC, traders should combine it with trend indicators and maintain strict risk management.
5.6 Does a BRAR buy signal guarantee that the price will rise?
No. Technical indicators are based on historical data and may not always be accurate. Trading signals only indicate potential market opportunities, so proper position management and risk control are essential.
The BRAR indicator uses AR and BR to analyze market sentiment from the perspectives of trading activity and buying and selling sentiment. It helps identify potential overbought and oversold conditions, as well as possible market reversals. Traders can apply BRAR on MEXC charts together with their own strategies and make informed decisions with proper risk management.
Recommended Reading:
Risk Disclaimer: Technical indicators are based on historical data and are provided for reference only. They do not guarantee future market performance or trading results. Digital asset markets are highly volatile and involve significant risks. Please evaluate your own risk tolerance, conduct independent research, and make informed trading decisions.