

How to Use the CYC Indicator in Stocks Trading: A Complete Beginner's Guide
Key Takeaways:
- The Cost Line (CYC) indicator consists of four lines: the 5-day, 13-day, 34-day, and infinite-period (∞) cost lines. They provide estimates of market participants' average holding costs.
- The key difference between CYC and conventional price-based moving averages is volume weighting, which incorporates trading activity into the analysis.
- Bullish and bearish alignments of the cost lines can help identify trends in individual stocks or the broader market.
- Buying on a pullback to a cost line and using a break below a cost line as a stop-loss reference are two basic approaches beginners can study.
- MEXC supports the CYC indicator in Stocks trading, allowing users to add it directly to their charts for analysis.
1. What Is the Cost Line Indicator?
The Cost Line (CYC) indicator is a technical analysis tool that uses volume-weighted calculations. Unlike conventional moving averages that average prices alone, CYC takes both transaction prices and trading volume into account. It is designed to estimate market participants' average entry cost rather than simply track an unweighted price average.
In simple terms, a cost line estimates the average price paid by investors who bought a stock over a given period. When the stock price is above the line, it is above that estimated average cost, suggesting a more favorable unrealized profit position. When the price is below the line, it suggests unrealized losses relative to that cost estimate. This makes CYC a useful reference for assessing the balance between buying and selling pressure.
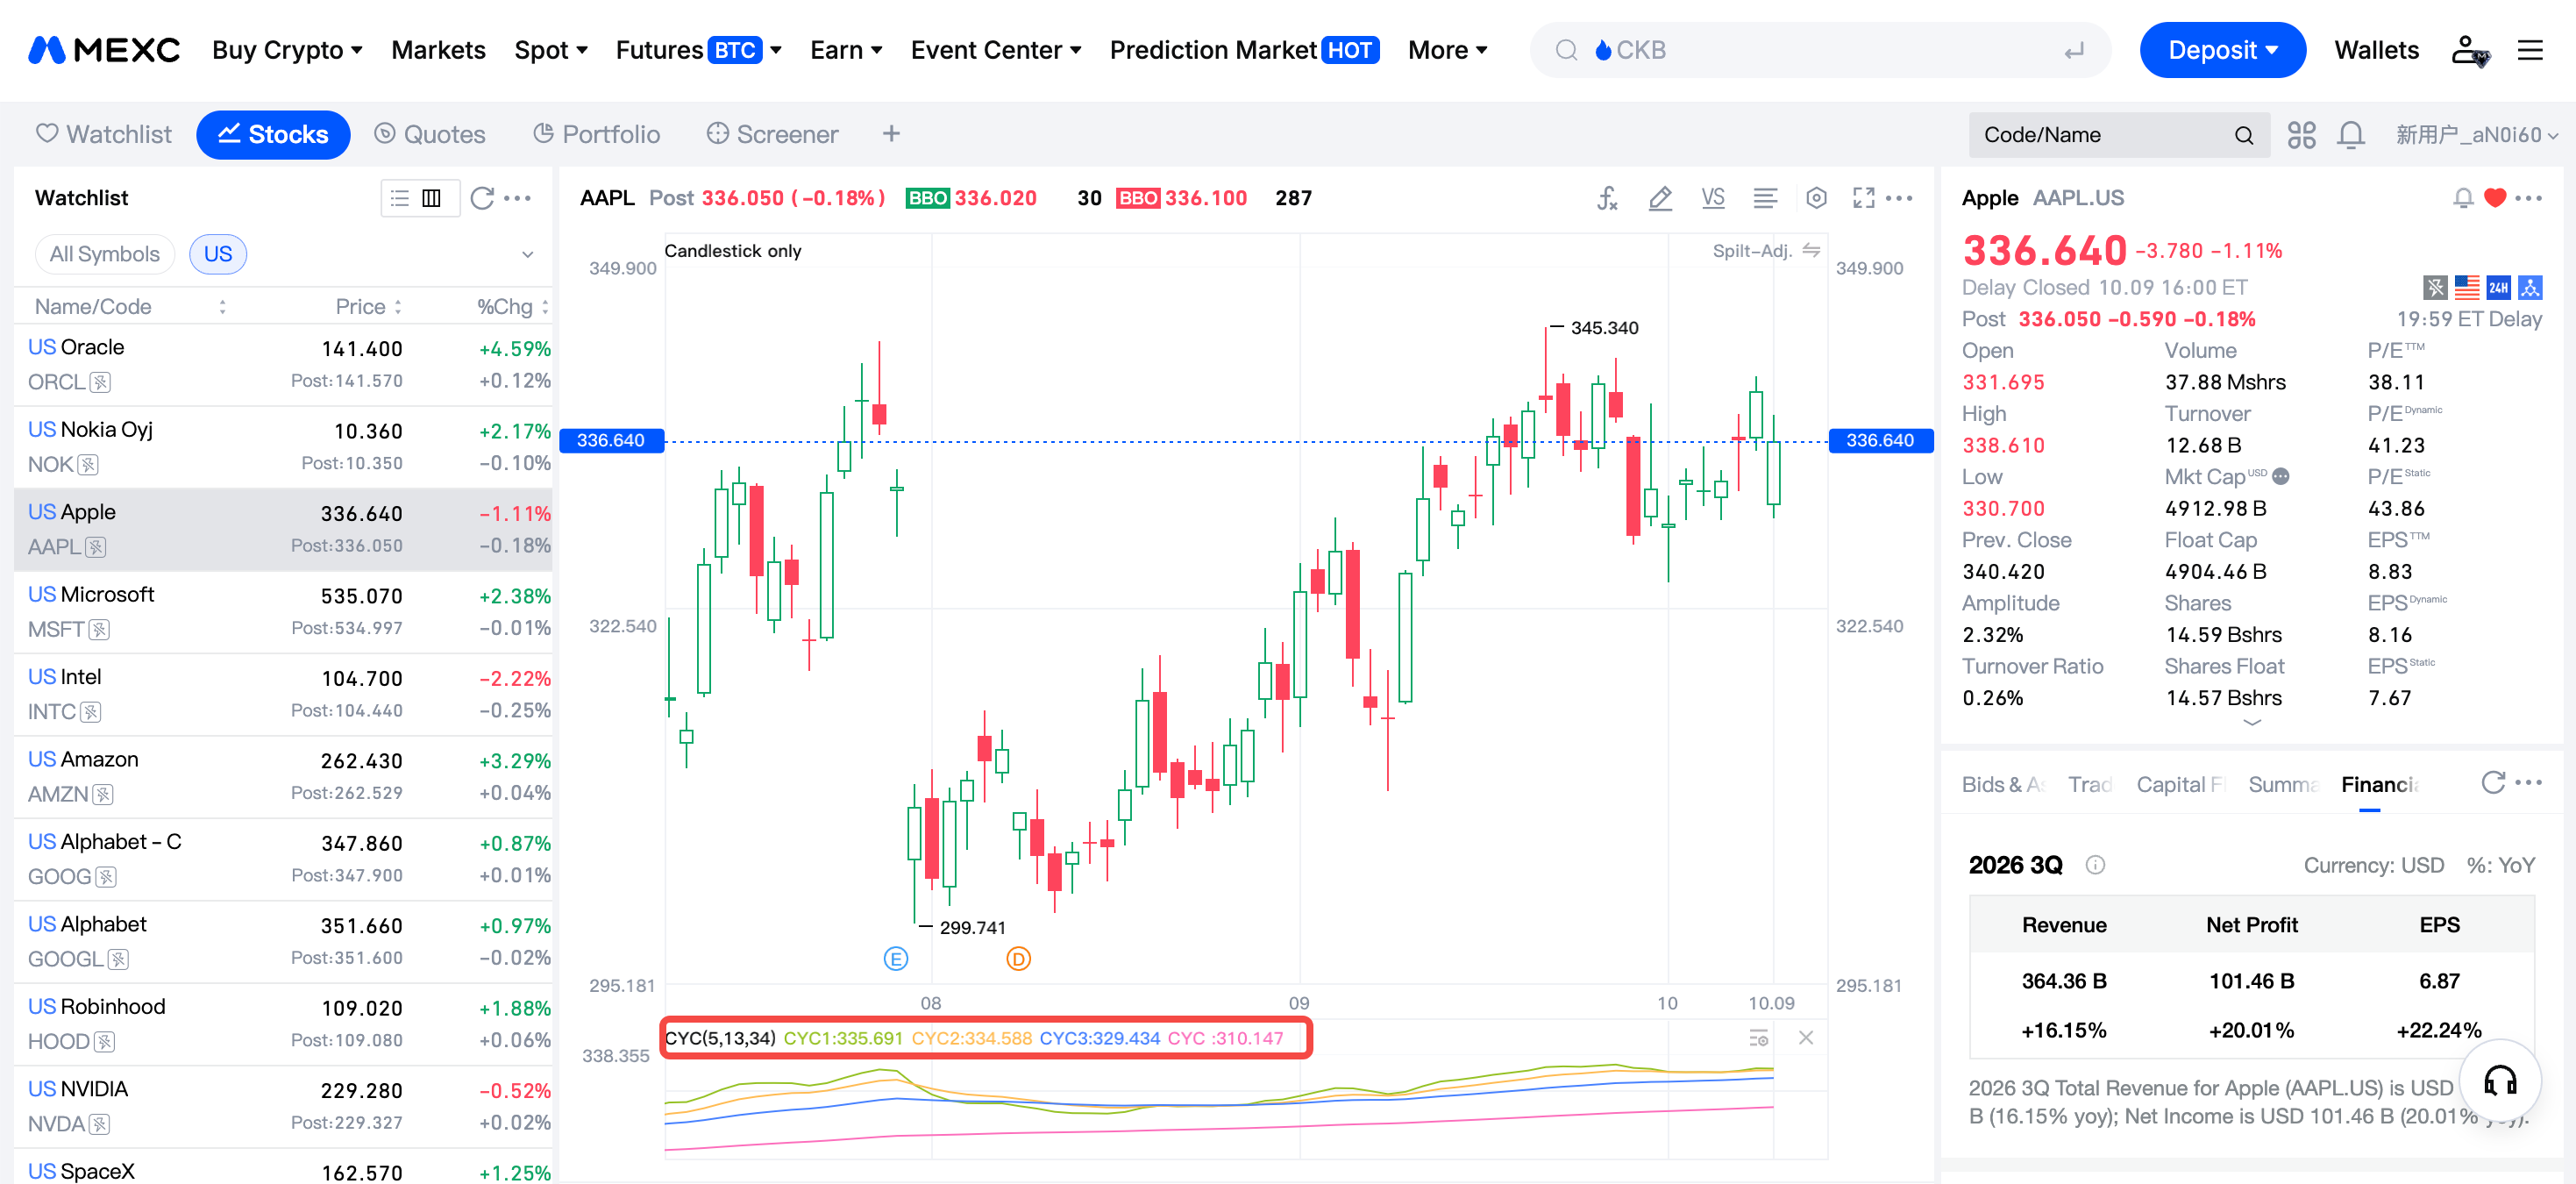
2. Components of the CYC Indicator
CYC typically consists of four cost lines with different calculation periods:
- 5-day cost line (short-term): Estimates the average entry cost over the latest five trading days. It is the most responsive of the four lines and can help identify potential short-term entries and exits.
- 13-day cost line (short-to-medium-term): Estimates the average market cost over the latest 13 trading days and is commonly used to assess the current trend's strength.
- 34-day cost line (medium-term): Estimates medium-term market costs. It is commonly used as a reference for potential support during medium-term corrections, where a pullback may stabilize.
- Infinite-period cost line (∞ line): Uses historical trading data to estimate the average cost of outstanding holdings. It serves as a longer-term reference for the balance between buyers and sellers and potential shifts between bullish and bearish trends.
CYC can also be viewed on daily, weekly, and monthly charts. Traders can choose a timeframe that matches their trading horizon.
3. CYC vs. Conventional Moving Averages
Conventional moving averages use price data, typically closing prices, to smooth price trends. They lag behind price changes, so the effect of a large institutional purchase may take several days to become clear. CYC uses the open, high, low, and closing prices together with volume weighting, allowing large-volume transactions to have a greater influence on the calculation and potentially producing a faster response.
More importantly, cost lines offer a way to interpret price relative to estimated holding costs and assess whether positions may be in profit or loss. Their bullish or bearish alignments may be more stable, with fewer crossovers driven by market noise before a broader trend reversal. This can help traders assess whether an apparent trend change is meaningful.
4. How to Use CYC to Identify Trends in Stocks
The relative positions of the cost lines are central to trend analysis. There are three main configurations:
1) A bullish alignment forms when shorter-period cost lines sit above longer-period lines in sequence: stock price > 5-day line > 13-day line > 34-day line. This suggests an uptrend in which estimated holding costs are rising across timeframes. Traders may use it to assess whether to maintain a position or look for potential entries.
2) A bearish alignment forms when shorter-period cost lines sit below longer-period lines in sequence. It suggests that holders with unrealized losses may create selling pressure as prices rebound toward their entry levels. In this environment, waiting on the sidelines may be more appropriate.
3) When the cost lines are intertwined without a clear order, the market is typically ranging. Large positions are generally best avoided in these conditions.
The infinite-period cost line is often used as a reference for distinguishing bullish and bearish market conditions. In an uptrend, it may provide a reference for strong support during short-term pullbacks. In a downtrend, rebounds may repeatedly stall near it. A break above the line on increased volume may signal that the downtrend is ending. A break below it after an advance is commonly treated as an important exit signal.
5. Three Practical CYC Trading Strategies
1) Buying on a pullback to a cost line. In a strong uptrend, the price may pull back toward the estimated average market cost before resuming its rise. Traders can wait for a pullback to the 13-day or 34-day cost line and consider entering when signs of stabilization and reversal appear nearby. If a moderate pullback holds above the 34-day line, it may support the case for the medium-term uptrend to continue.
2) Trading a breakout after the cost lines converge. When several cost lines cluster tightly together, buying and selling pressure may be relatively balanced, potentially preceding a significant change in direction. A breakout above all the clustered lines on increased volume suggests strengthening buying pressure and may offer an entry signal. A high-volume break below the cluster may indicate weakening support and prompt traders to consider exiting.
3) Using cost lines for stop-loss decisions. During an uptrend, one approach is to consider buying when the price crosses above the 13-day cost line and selling when it falls below that line. This provides a structured way to manage entries and exits, but it is not suitable for sideways consolidation. A rising cost line that flattens may warn of weakening momentum, while a downward turn provides further evidence of a potential decline. A death cross between cost lines may be treated as a final exit signal.
6. Using CYC in Stocks Trading on MEXC
MEXC supports the CYC indicator in Stocks trading. Users can select CYC in the trading interface's charting tools to analyze the cost lines. Beginners can start by screening stocks according to the lines' alignment, focusing on bullish alignments and avoiding bearish ones.
When using CYC on MEXC, combine it with trading volume. A pullback that holds near a cost line on declining volume may suggest easing selling pressure and support the possibility of a subsequent rise. If volume increases during a rebound but the price makes little progress, be alert to a breakout that may fail. Other trend indicators can also provide confirmation to support more informed trading decisions.
7. Important Considerations When Using CYC
1) Avoid relying on CYC alone. Although it estimates holding costs, it should be assessed alongside broader market conditions, related sector movements, and fundamentals.
2) Be cautious in ranging markets. During sideways consolidation, the price can repeatedly cross the cost lines, reducing the reliability of the signals. Wait for a clear directional breakout before using CYC to guide trades.
3) Check the parameters. Different platforms may represent the infinite-period cost line's settings differently. Confirm that the parameters are correct before using the indicator.
8. CYC FAQ
8.1 What does the cost line indicate?
A cost line is a volume-weighted moving average designed to estimate market participants' average entry cost over a given period. Comparing the price with this estimate can help assess the overall unrealized profit or loss position of holders.
8.2 What is a cost period?
The cost period is the timeframe used in a cost line's calculation. Common settings on a daily chart are 5 days, 13 days, 34 days, and an infinite-period line. Shorter periods respond more quickly to price changes, while longer periods provide a clearer view of longer-term trends.
8.3 How can you identify a stock's market cycle?
Observe the alignment and crossovers of cost lines with different periods. A bullish alignment suggests an upward phase, while a bearish alignment suggests a downward phase. Closely clustered cost lines may indicate that a new directional phase is approaching.
8.4 How does CYC differ from conventional moving averages?
Conventional price-based moving averages average prices alone. CYC adds volume weighting to estimate holding costs and give greater influence to large-volume transactions. This may help filter market noise and provide a faster response to changes in trading activity.
8.5 Should you always sell when the price falls below a cost line?
No. The context matters. A break below the 5-day or 13-day cost line may simply reflect a short-term correction. A high-volume break below the 34-day or infinite-period cost line, however, may indicate a weakening medium-to-long-term trend and warrant considering a stop-loss exit.
8.6 How can beginners get started with CYC in Stocks trading?
Start with a simple framework: focus on stocks with bullish cost-line alignments, consider entries when pullbacks hold above the cost lines, and use breaks below key cost lines as stop-loss references. Always use volume to help confirm the signals.