Buy Crypto
Markets
Spot
FuturesBTC
Earn
Event Center
Rewards Hub
More
How to Use the Ichimoku Cloud Indicator in Trading: A Complete Beginner's GuideHow to Use the Ichimoku Cloud Indicator in Trading: A Complete Beginner's Guide
Category List
Cancel

How to Use the Ichimoku Cloud Indicator in Trading: A Complete Beginner's Guide

Key Takeaways

  • The Ichimoku Cloud is a comprehensive technical indicator that combines trend direction, support and resistance, and momentum analysis.
  • The indicator consists of five lines: the Conversion Line, Base Line, Lagging Span, Leading Span A, and Leading Span B. The area between the two leading spans forms the cloud.
  • Traders can assess market trends and identify potential buy and sell signals by observing the price's position relative to the cloud, changes in cloud color, and line crossovers.
  • The Ichimoku Cloud can be enabled and customized directly on MEXC Spot and Futures trading charts to support everyday trading decisions.

1. What Is the Ichimoku Cloud?


The Ichimoku Cloud is a technical analysis method that combines multiple indicators into a single chart. Its name reflects the idea of understanding market conditions at a glance. The indicator was developed by Japanese journalist Goichi Hosoda in the 1930s. After years of research and refinement, it was publicly introduced in the 1960s and has since become a classic indicator widely used by traders around the world.

Unlike traditional moving averages, the Ichimoku Cloud can simultaneously display potential support and resistance levels, trend direction, and price momentum. This allows traders to assess the broader market picture on a single chart and identify potential entry and exit opportunities more efficiently. The Ichimoku Cloud is currently available on MEXC Spot and Futures trading charts and can be added directly to the candlestick chart.
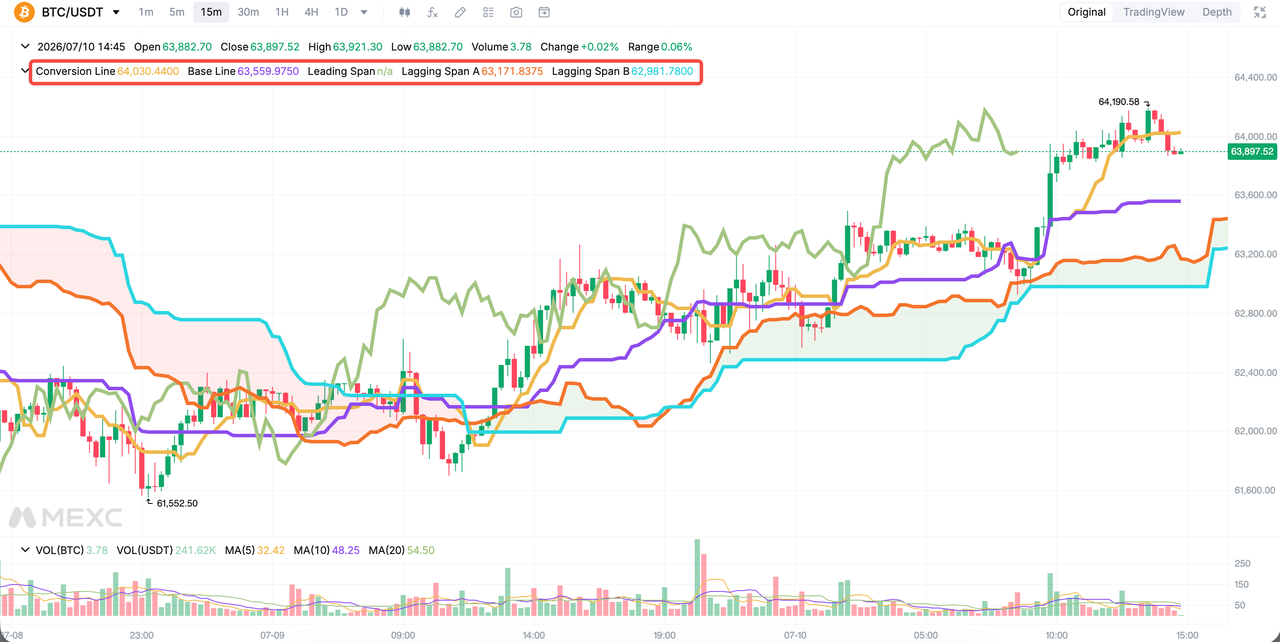

2. How Is the Ichimoku Cloud Calculated? Five Main Components Explained


Understanding the Ichimoku Cloud requires knowing how its five components are calculated and what they represent.

Conversion Line: Based on nine periods and calculated as:

(Highest high over the past nine periods + Lowest low over the past nine periods) / 2

The Conversion Line responds most quickly to price movements and represents short-term price momentum.

Base Line: Based on 26 periods and calculated as:

(Highest high over the past 26 periods + Lowest low over the past 26 periods) / 2

The Base Line is smoother and represents the medium-term trend. It is also commonly used as a reference for dynamic support and resistance.

Lagging Span: The current closing price plotted 26 periods back. It is used to compare the current price with historical prices and help confirm the trend.

Leading Span A: Calculated as:

(Conversion Line + Base Line) / 2

The result is plotted 26 periods ahead and forms one boundary of the cloud.

Leading Span B: Calculated as:

(Highest high over the past 52 periods + Lowest low over the past 52 periods) / 2

The result is also plotted 26 periods ahead and forms the other boundary of the cloud.

Cloud: The area between Leading Span A and Leading Span B. It is the central component of the indicator. Because the cloud is projected 26 periods into the future, it can help traders identify potential future support and resistance areas.

3. How to Interpret the Ichimoku Cloud


The Ichimoku Cloud can mainly be interpreted from three main ways.

First, observe the price's position relative to the cloud. When the market price is above the cloud, it produces a bullish signal and indicates an uptrend. When the price is below the cloud, it generally indicates bearish conditions and indicates a downtrend. When the price is moving inside the cloud, the market is generally considered to be ranging or consolidating. Traders should remain cautious and wait for a clear breakout signal.

Second, observe the color of the cloud. When Leading Span A is above Leading Span B, a green cloud is formed, indicating bullish conditions. When Leading Span A is below Leading Span B, a red cloud is formed, indicating bearish conditions. A change from a red cloud to a green cloud is considered bullish, while a change from green to red is considered bearish.

Third, observe the thickness of the cloud. A thicker cloud generally indicates stronger support or resistance, making price breakouts more difficult. A thinner cloud suggests weaker support or resistance, making it easier for the price to break through.

4. Ichimoku Cloud Buy and Sell Signals


The Ichimoku Cloud can generate several clear trading signals. Beginners may focus on the following types.

Conversion Line and Base Line Crossover Signals: During an uptrend, if the price is above the cloud and the Conversion Line crosses above the Base Line, it may provide a buy signal. During a downtrend, if the price is below the cloud and the Conversion Line crosses below the Base Line, it may provide a sell signal. These signals follow logic similar to golden crosses and death crosses between moving averages, but they may respond more quickly.

Price and Base Line Crossover Signals: During an uptrend, when the price crosses above the Base Line while remaining above the cloud, it may provide a buy signal. During a downtrend, when the price crosses below the Base Line while remaining below the cloud, it may provide a sell signal.

Cloud Breakout Signals: When the price breaks above the cloud from below and remains there, it may indicate that the trend is shifting from weak to strong. This is generally considered a relatively reliable medium- to long-term buy signal. When the price breaks below the cloud, it may indicate that the trend is weakening, and traders may consider exiting or opening a short position.

Signals aligned with the broader trend are generally more reliable. When the price is above a green cloud, traders may prioritize buy signals. When the price is below a red cloud, they may prioritize sell signals. Countertrend signals are generally weaker and should be approached cautiously, especially by beginners.

5. Entry and Exit Strategy for Beginners Using the Ichimoku Cloud


Beginners may use the following as a simple entry and exit framework:

1. Use the cloud to determine the broader trend direction and only trade in the same direction as the trend.
2. Wait for confirmation signals. For example, after the price breaks above the cloud, wait for the Conversion Line to cross above the Base Line while the Lagging Span is also above historical prices. Using multiple confirmation signals may improve reliability.
3. After entering a position, place the stop-loss below the Base Line or outside the cloud boundary to control the risk of each trade.
4. If the Conversion Line crosses the Base Line in the opposite direction or the price moves back into the cloud, consider taking profits gradually or exiting the position.

Traders may also combine the Ichimoku Cloud with tools such as the Relative Strength Index and exponential moving averages to filter false signals in sideways markets and improve market analysis.

6. How to Use the Ichimoku Cloud on MEXC


Navigation: MEXC official website → Spot/Futures → Indicators → Ichimoku Cloud

Once the indicator is enabled, the values for each component will be displayed above the candlestick chart based on the cursor position. Click the settings button to adjust the basic parameters, which are set to 9, 26, 52, and 26 by default. You can also customize the color and thickness of each line according to your preferences. To remove the indicator, click the corresponding close button.


7. Ichimoku Cloud FAQ


7.1 What is the Ichimoku Cloud?


The Ichimoku Cloud is a comprehensive technical analysis indicator consisting of the Conversion Line, Base Line, Lagging Span, Leading Span A, and Leading Span B. It displays trend direction, momentum, and potential support and resistance areas, allowing traders to assess market conditions at a glance.

7.2 How do I interpret the Ichimoku Cloud?


The main method is to observe the price's position relative to the cloud. Prices above the cloud indicate a bullish trend, prices below indicate a bearish trend, and prices inside signal consolidation. Traders may also consider the cloud color, with green indicating bullish conditions and red indicating bearish conditions, together with line crossover signals.

7.3 What are the main Ichimoku Cloud buy and sell signals?


The main buy signals include:
  • The price breaking above the cloud
  • The cloud changing from red to green
  • The Conversion Line crossing above the Base Line
  • The price crossing above the Base Line

The main sell signals are the opposite:
  • The price breaking below the cloud
  • The cloud changing from green to red
  • The Conversion Line crossing below the Base Line
  • The price crossing below the Base Line

7.4 Does the Ichimoku Cloud strategy have a high success rate?


No indicator can guarantee profits. The Ichimoku Cloud generally performs better in clearly trending markets but may generate false signals during sideways or ranging conditions. Using multiple confirmation signals, combining the indicator with other tools, and applying strict stop-loss management may improve the reliability of the strategy.

7.5 Is the Ichimoku Cloud suitable for day trading?


Yes. Short-term traders can use the indicator on lower timeframes. However, because shorter timeframes contain more market noise, it is recommended to confirm the broader trend on a higher timeframe first and then look for entries in the same direction on a lower timeframe. Stop-loss levels may also need to be tightened accordingly.

7.6 How do I use the Ichimoku Cloud indicator on MEXC?


Log in to the MEXC official website and go to the Spot or Futures trading page. Click Indicators and select Ichimoku Cloud to enable it. The indicator's parameters and line styles can also be customized.

The Ichimoku Cloud provides traders with a powerful tool for understanding market trends and is particularly suitable for trend-following strategies. However, no indicator is effective under all market conditions. It is recommended to combine the Ichimoku Cloud with other indicators and set appropriate stop-loss levels when opening positions on MEXC to manage trading risk.


Risk Warning: Technical indicators are based on historical data and do not guarantee future performance. Digital assets are highly volatile. Trade cautiously based on your risk tolerance and avoid blindly following market trends.

How to Use the Ichimoku Cloud Indicator in Trading: A Complete Beginner's Guide

Key Takeaways

  • The Ichimoku Cloud is a comprehensive technical indicator that combines trend direction, support and resistance, and momentum analysis.
  • The indicator consists of five lines: the Conversion Line, Base Line, Lagging Span, Leading Span A, and Leading Span B. The area between the two leading spans forms the cloud.
  • Traders can assess market trends and identify potential buy and sell signals by observing the price's position relative to the cloud, changes in cloud color, and line crossovers.
  • The Ichimoku Cloud can be enabled and customized directly on MEXC Spot and Futures trading charts to support everyday trading decisions.

1. What Is the Ichimoku Cloud?


The Ichimoku Cloud is a technical analysis method that combines multiple indicators into a single chart. Its name reflects the idea of understanding market conditions at a glance. The indicator was developed by Japanese journalist Goichi Hosoda in the 1930s. After years of research and refinement, it was publicly introduced in the 1960s and has since become a classic indicator widely used by traders around the world.

Unlike traditional moving averages, the Ichimoku Cloud can simultaneously display potential support and resistance levels, trend direction, and price momentum. This allows traders to assess the broader market picture on a single chart and identify potential entry and exit opportunities more efficiently. The Ichimoku Cloud is currently available on MEXC Spot and Futures trading charts and can be added directly to the candlestick chart.


2. How Is the Ichimoku Cloud Calculated? Five Main Components Explained


Understanding the Ichimoku Cloud requires knowing how its five components are calculated and what they represent.

Conversion Line: Based on nine periods and calculated as:

(Highest high over the past nine periods + Lowest low over the past nine periods) / 2

The Conversion Line responds most quickly to price movements and represents short-term price momentum.

Base Line: Based on 26 periods and calculated as:

(Highest high over the past 26 periods + Lowest low over the past 26 periods) / 2

The Base Line is smoother and represents the medium-term trend. It is also commonly used as a reference for dynamic support and resistance.

Lagging Span: The current closing price plotted 26 periods back. It is used to compare the current price with historical prices and help confirm the trend.

Leading Span A: Calculated as:

(Conversion Line + Base Line) / 2

The result is plotted 26 periods ahead and forms one boundary of the cloud.

Leading Span B: Calculated as:

(Highest high over the past 52 periods + Lowest low over the past 52 periods) / 2

The result is also plotted 26 periods ahead and forms the other boundary of the cloud.

Cloud: The area between Leading Span A and Leading Span B. It is the central component of the indicator. Because the cloud is projected 26 periods into the future, it can help traders identify potential future support and resistance areas.

3. How to Interpret the Ichimoku Cloud


The Ichimoku Cloud can mainly be interpreted from three main ways.

First, observe the price's position relative to the cloud. When the market price is above the cloud, it produces a bullish signal and indicates an uptrend. When the price is below the cloud, it generally indicates bearish conditions and indicates a downtrend. When the price is moving inside the cloud, the market is generally considered to be ranging or consolidating. Traders should remain cautious and wait for a clear breakout signal.

Second, observe the color of the cloud. When Leading Span A is above Leading Span B, a green cloud is formed, indicating bullish conditions. When Leading Span A is below Leading Span B, a red cloud is formed, indicating bearish conditions. A change from a red cloud to a green cloud is considered bullish, while a change from green to red is considered bearish.

Third, observe the thickness of the cloud. A thicker cloud generally indicates stronger support or resistance, making price breakouts more difficult. A thinner cloud suggests weaker support or resistance, making it easier for the price to break through.

4. Ichimoku Cloud Buy and Sell Signals


The Ichimoku Cloud can generate several clear trading signals. Beginners may focus on the following types.

Conversion Line and Base Line Crossover Signals: During an uptrend, if the price is above the cloud and the Conversion Line crosses above the Base Line, it may provide a buy signal. During a downtrend, if the price is below the cloud and the Conversion Line crosses below the Base Line, it may provide a sell signal. These signals follow logic similar to golden crosses and death crosses between moving averages, but they may respond more quickly.

Price and Base Line Crossover Signals: During an uptrend, when the price crosses above the Base Line while remaining above the cloud, it may provide a buy signal. During a downtrend, when the price crosses below the Base Line while remaining below the cloud, it may provide a sell signal.

Cloud Breakout Signals: When the price breaks above the cloud from below and remains there, it may indicate that the trend is shifting from weak to strong. This is generally considered a relatively reliable medium- to long-term buy signal. When the price breaks below the cloud, it may indicate that the trend is weakening, and traders may consider exiting or opening a short position.

Signals aligned with the broader trend are generally more reliable. When the price is above a green cloud, traders may prioritize buy signals. When the price is below a red cloud, they may prioritize sell signals. Countertrend signals are generally weaker and should be approached cautiously, especially by beginners.

5. Entry and Exit Strategy for Beginners Using the Ichimoku Cloud


Beginners may use the following as a simple entry and exit framework:

1. Use the cloud to determine the broader trend direction and only trade in the same direction as the trend.
2. Wait for confirmation signals. For example, after the price breaks above the cloud, wait for the Conversion Line to cross above the Base Line while the Lagging Span is also above historical prices. Using multiple confirmation signals may improve reliability.
3. After entering a position, place the stop-loss below the Base Line or outside the cloud boundary to control the risk of each trade.
4. If the Conversion Line crosses the Base Line in the opposite direction or the price moves back into the cloud, consider taking profits gradually or exiting the position.

Traders may also combine the Ichimoku Cloud with tools such as the Relative Strength Index and exponential moving averages to filter false signals in sideways markets and improve market analysis.

6. How to Use the Ichimoku Cloud on MEXC


Navigation: MEXC official website → Spot/Futures → Indicators → Ichimoku Cloud

Once the indicator is enabled, the values for each component will be displayed above the candlestick chart based on the cursor position. Click the settings button to adjust the basic parameters, which are set to 9, 26, 52, and 26 by default. You can also customize the color and thickness of each line according to your preferences. To remove the indicator, click the corresponding close button.


7. Ichimoku Cloud FAQ


7.1 What is the Ichimoku Cloud?


The Ichimoku Cloud is a comprehensive technical analysis indicator consisting of the Conversion Line, Base Line, Lagging Span, Leading Span A, and Leading Span B. It displays trend direction, momentum, and potential support and resistance areas, allowing traders to assess market conditions at a glance.

7.2 How do I interpret the Ichimoku Cloud?


The main method is to observe the price's position relative to the cloud. Prices above the cloud indicate a bullish trend, prices below indicate a bearish trend, and prices inside signal consolidation. Traders may also consider the cloud color, with green indicating bullish conditions and red indicating bearish conditions, together with line crossover signals.

7.3 What are the main Ichimoku Cloud buy and sell signals?


The main buy signals include:
  • The price breaking above the cloud
  • The cloud changing from red to green
  • The Conversion Line crossing above the Base Line
  • The price crossing above the Base Line

The main sell signals are the opposite:
  • The price breaking below the cloud
  • The cloud changing from green to red
  • The Conversion Line crossing below the Base Line
  • The price crossing below the Base Line

7.4 Does the Ichimoku Cloud strategy have a high success rate?


No indicator can guarantee profits. The Ichimoku Cloud generally performs better in clearly trending markets but may generate false signals during sideways or ranging conditions. Using multiple confirmation signals, combining the indicator with other tools, and applying strict stop-loss management may improve the reliability of the strategy.

7.5 Is the Ichimoku Cloud suitable for day trading?


Yes. Short-term traders can use the indicator on lower timeframes. However, because shorter timeframes contain more market noise, it is recommended to confirm the broader trend on a higher timeframe first and then look for entries in the same direction on a lower timeframe. Stop-loss levels may also need to be tightened accordingly.

7.6 How do I use the Ichimoku Cloud indicator on MEXC?


Log in to the MEXC official website and go to the Spot or Futures trading page. Click Indicators and select Ichimoku Cloud to enable it. The indicator's parameters and line styles can also be customized.

The Ichimoku Cloud provides traders with a powerful tool for understanding market trends and is particularly suitable for trend-following strategies. However, no indicator is effective under all market conditions. It is recommended to combine the Ichimoku Cloud with other indicators and set appropriate stop-loss levels when opening positions on MEXC to manage trading risk.


Risk Warning: Technical indicators are based on historical data and do not guarantee future performance. Digital assets are highly volatile. Trade cautiously based on your risk tolerance and avoid blindly following market trends.