

How to Use the SRDM Indicator in U.S. Stock Trading: A Complete Beginner's Guide
Key Takeaways:
- SRDM is a price-based trend indicator that compares upward and downward momentum.
- SRDM uses changes in highs and lows to calculate upward and downward movement, then compares their moving averages to derive a ratio.
- Positive and negative SRDM readings can help traders assess the relative strength of upward and downward momentum.
- Crossovers between the SRDM line and its smoothed line, ASRDM, may provide reference signals for buying or reducing a position.
- MEXC supports SRDM for U.S. stock market analysis, helping users make informed trading decisions.
1. What Is the SRDM Indicator?
SRDM is a technical analysis indicator based on price movements. It uses historical highs and lows to compare upward and downward momentum over a given period, helping traders assess the direction and strength of a price trend.
For beginners in U.S. stock trading, SRDM turns complex price movements into an easy-to-read value. By observing whether the reading is positive or negative and how it changes, users can form a basic view of the market trend. When trading U.S. stocks on MEXC, users can use SRDM to support their analysis of an asset's price movements.
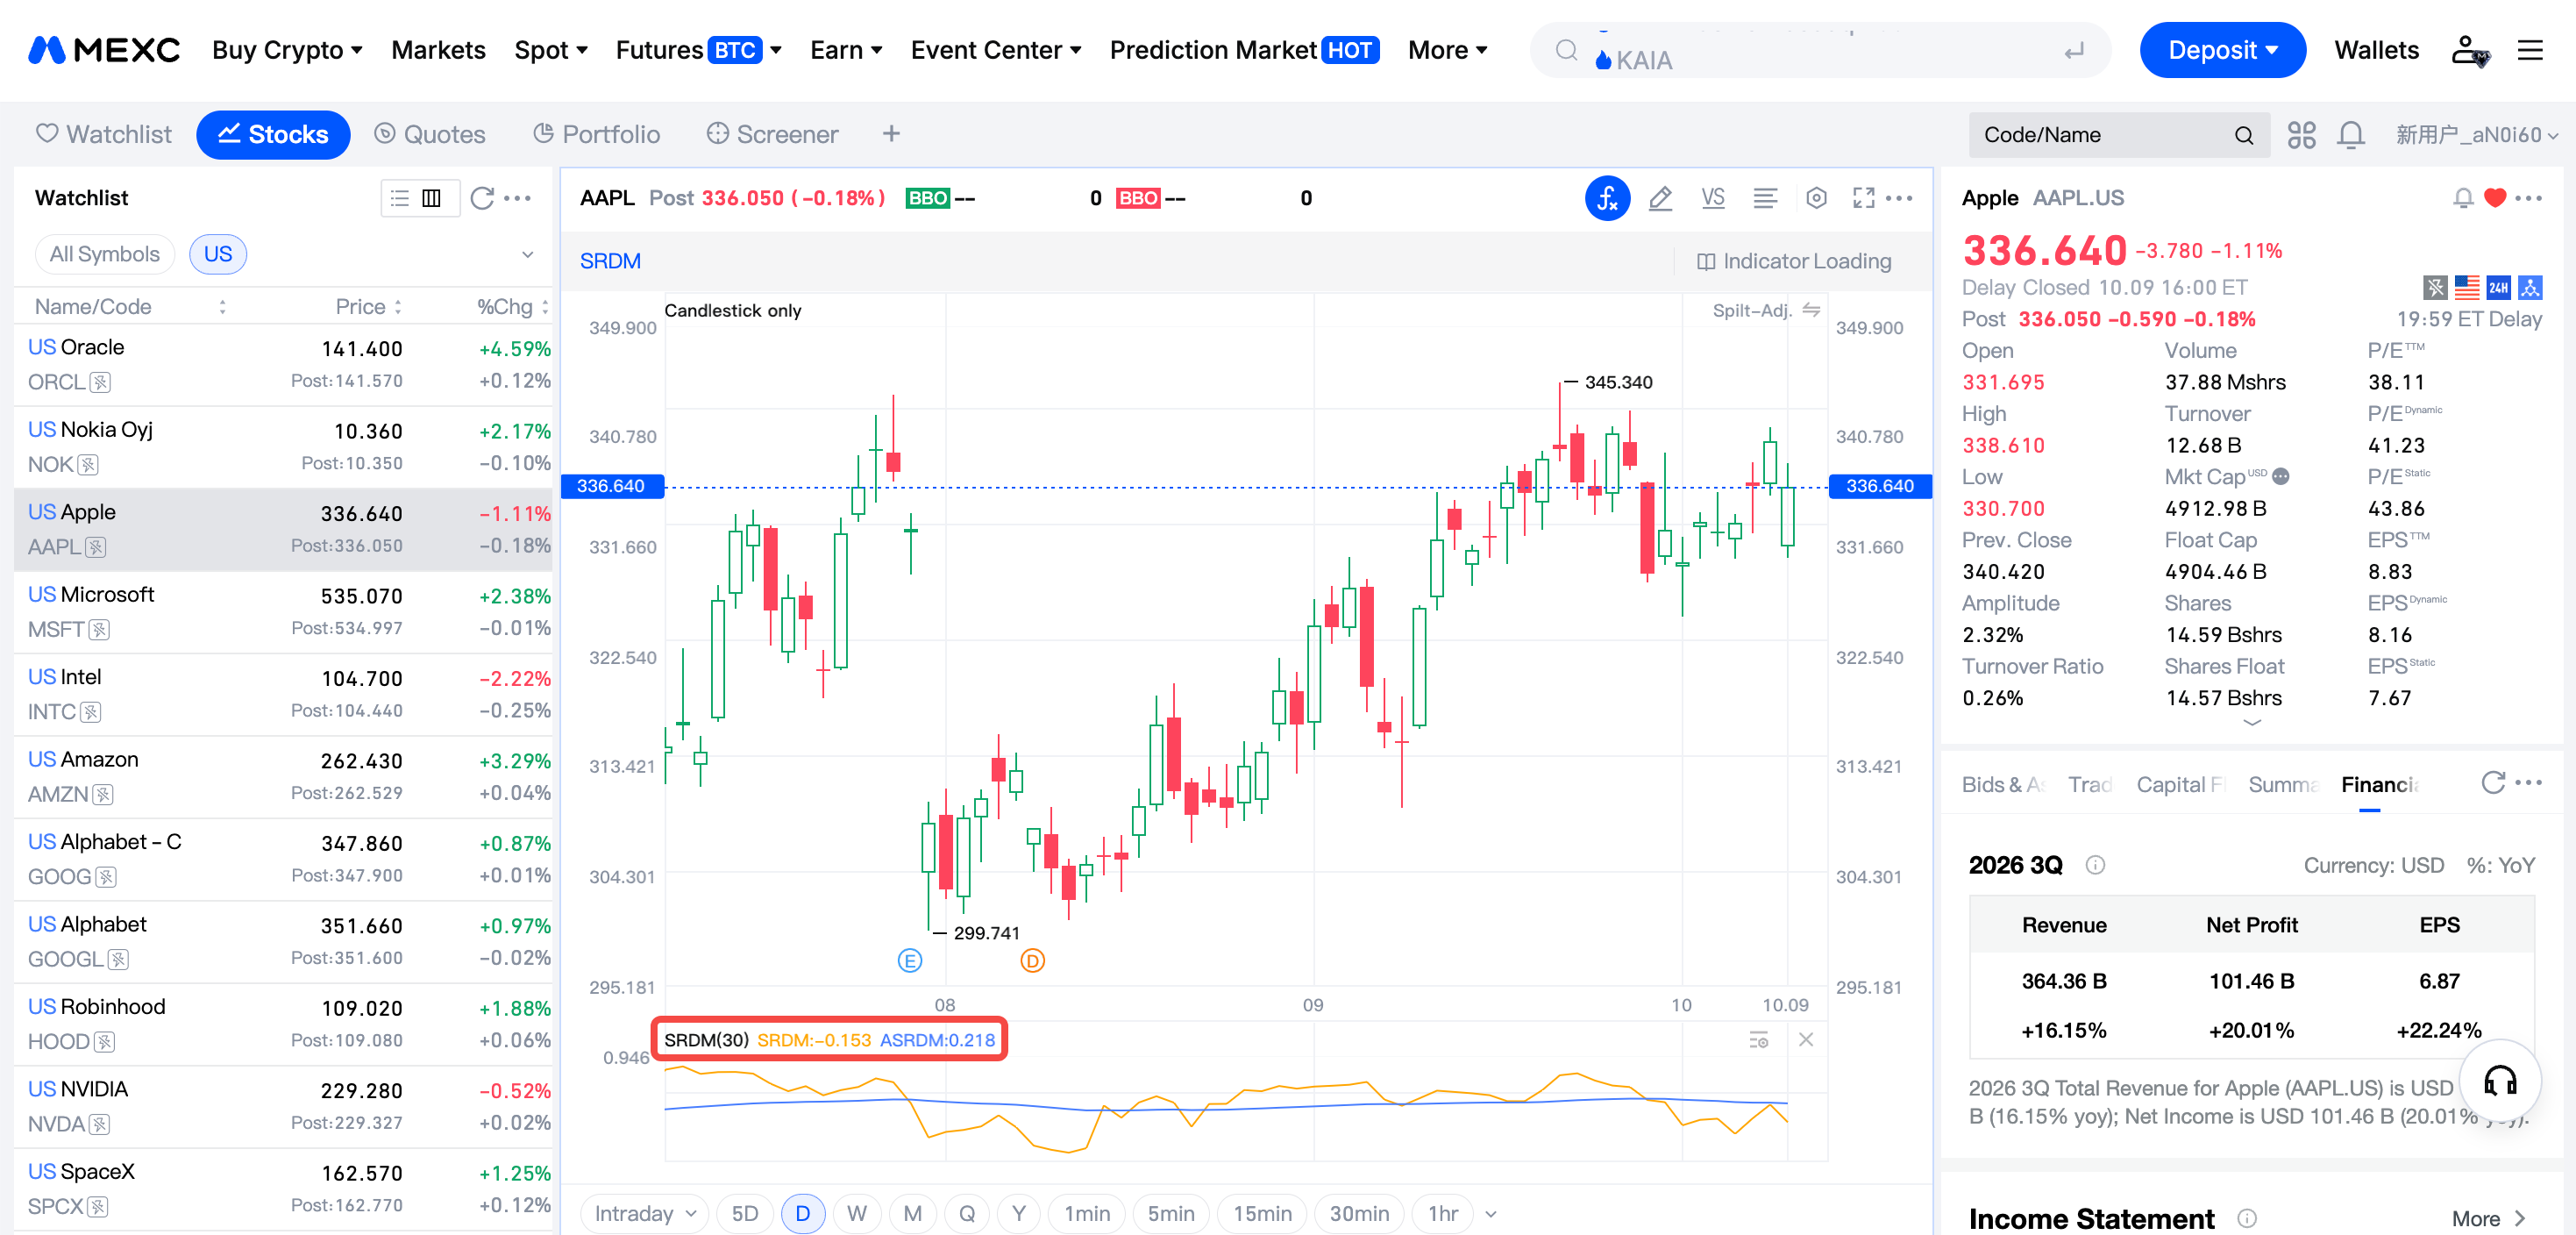
2. How to Calculate the SRDM Indicator
The SRDM calculation has four steps:
1) Calculate upward movement. If the sum of the current period's high and low is less than or equal to the previous period's sum, upward movement is zero. Otherwise, use the larger of the absolute change in the high and the absolute change in the low.
2) Calculate downward movement. If the sum of the current period's high and low is greater than or equal to the previous period's sum, downward movement is zero. Otherwise, use the larger of the two absolute changes.
3) Calculate a 10-day moving average of upward movement and a separate 10-day moving average of downward movement.
4) Compare the two averages. If average upward movement is greater, SRDM = (Average upward movement − Average downward movement) / Average upward movement. If average downward movement is greater, SRDM = (Average upward movement − Average downward movement) / Average downward movement. If the averages are equal, SRDM = 0. Finally, calculate a moving average of SRDM over a specified period, such as 30-day, to obtain ASRDM, the signal line
3. How to Interpret SRDM in U.S. Stock Trading
There are three main aspects to consider when interpreting SRDM:
1) Check whether the reading is positive or negative. A positive value may indicate that upward momentum is stronger, suggesting a bullish bias. A negative value may indicate that downward momentum is stronger, suggesting a bearish bias.
2) Assess the smoothed line. A higher positive ASRDM reading may suggest a stronger upward trend, while a more negative reading may suggest a stronger downward trend.
3) Watch for crossovers and changes in direction. When SRDM crosses above ASRDM, it may indicate a potential buying opportunity. Conversely, a crossover below ASRDM may suggest weakening momentum and a potential opportunity to reduce or exit a position.
Beginners should remember that any individual technical indicator can lag price movements and be affected by market noise, leading to inaccurate interpretations. When trading U.S. stocks on MEXC, combine SRDM with other tools, such as volume and moving averages, and apply appropriate position sizing and risk management.
4. SRDM FAQs
4.1 What does SRDM mean in trading?
In trading, SRDM refers to a price-based technical indicator that compares the strength of upward and downward momentum.
4.2 How does SRDM indicate potential buying and selling opportunities?
When SRDM crosses above ASRDM, it may signal strengthening upward momentum. When SRDM crosses below ASRDM, it may signal weakening momentum or increasing downward pressure.
4.3 What settings are commonly used for SRDM?
The upward and downward movement averages commonly use 10 periods, while ASRDM commonly uses 30 periods.
4.4 How does SRDM differ from other directional indicators?
SRDM uses a ratio to quantify the relative strength of upward and downward momentum, in addition to helping identify trend direction. Other directional indicators may place different emphasis on direction and strength.
4.5 Can I use SRDM for U.S. stock trading on MEXC?
Yes. MEXC supports SRDM for U.S. stock market analysis. Users can apply it to assess trends and inform trading decisions.