

How to Use the Stochastic Oscillator in Trading: A Complete Beginner's Guide
Key Takeaways
- The stochastic oscillator is a momentum indicator used to analyze short-term price movements. The KDJ indicator available on MEXC consists of the K, D, and J lines.
- Common KDJ signals include overbought and oversold conditions, golden crosses, death crosses, and bullish or bearish divergences.
- The standard KDJ setting is (9, 3, 3). Traders may adjust the lookback period according to their timeframe, but shorter settings tend to produce more noise.
- You can add KDJ directly to Spot or Futures charts on MEXC and adjust its parameters in the indicator settings.
- KDJ can remain overbought or oversold during strong trends and may produce false signals. It should be used with trend, momentum, and volume confirmation alongside appropriate risk controls.
1. What Is the Stochastic Oscillator?
The stochastic oscillator is a momentum indicator commonly used to assess short-term market conditions. It compares the latest closing price with the highest and lowest prices over a selected lookback period. This helps traders evaluate whether buying or selling momentum is strengthening or weakening.
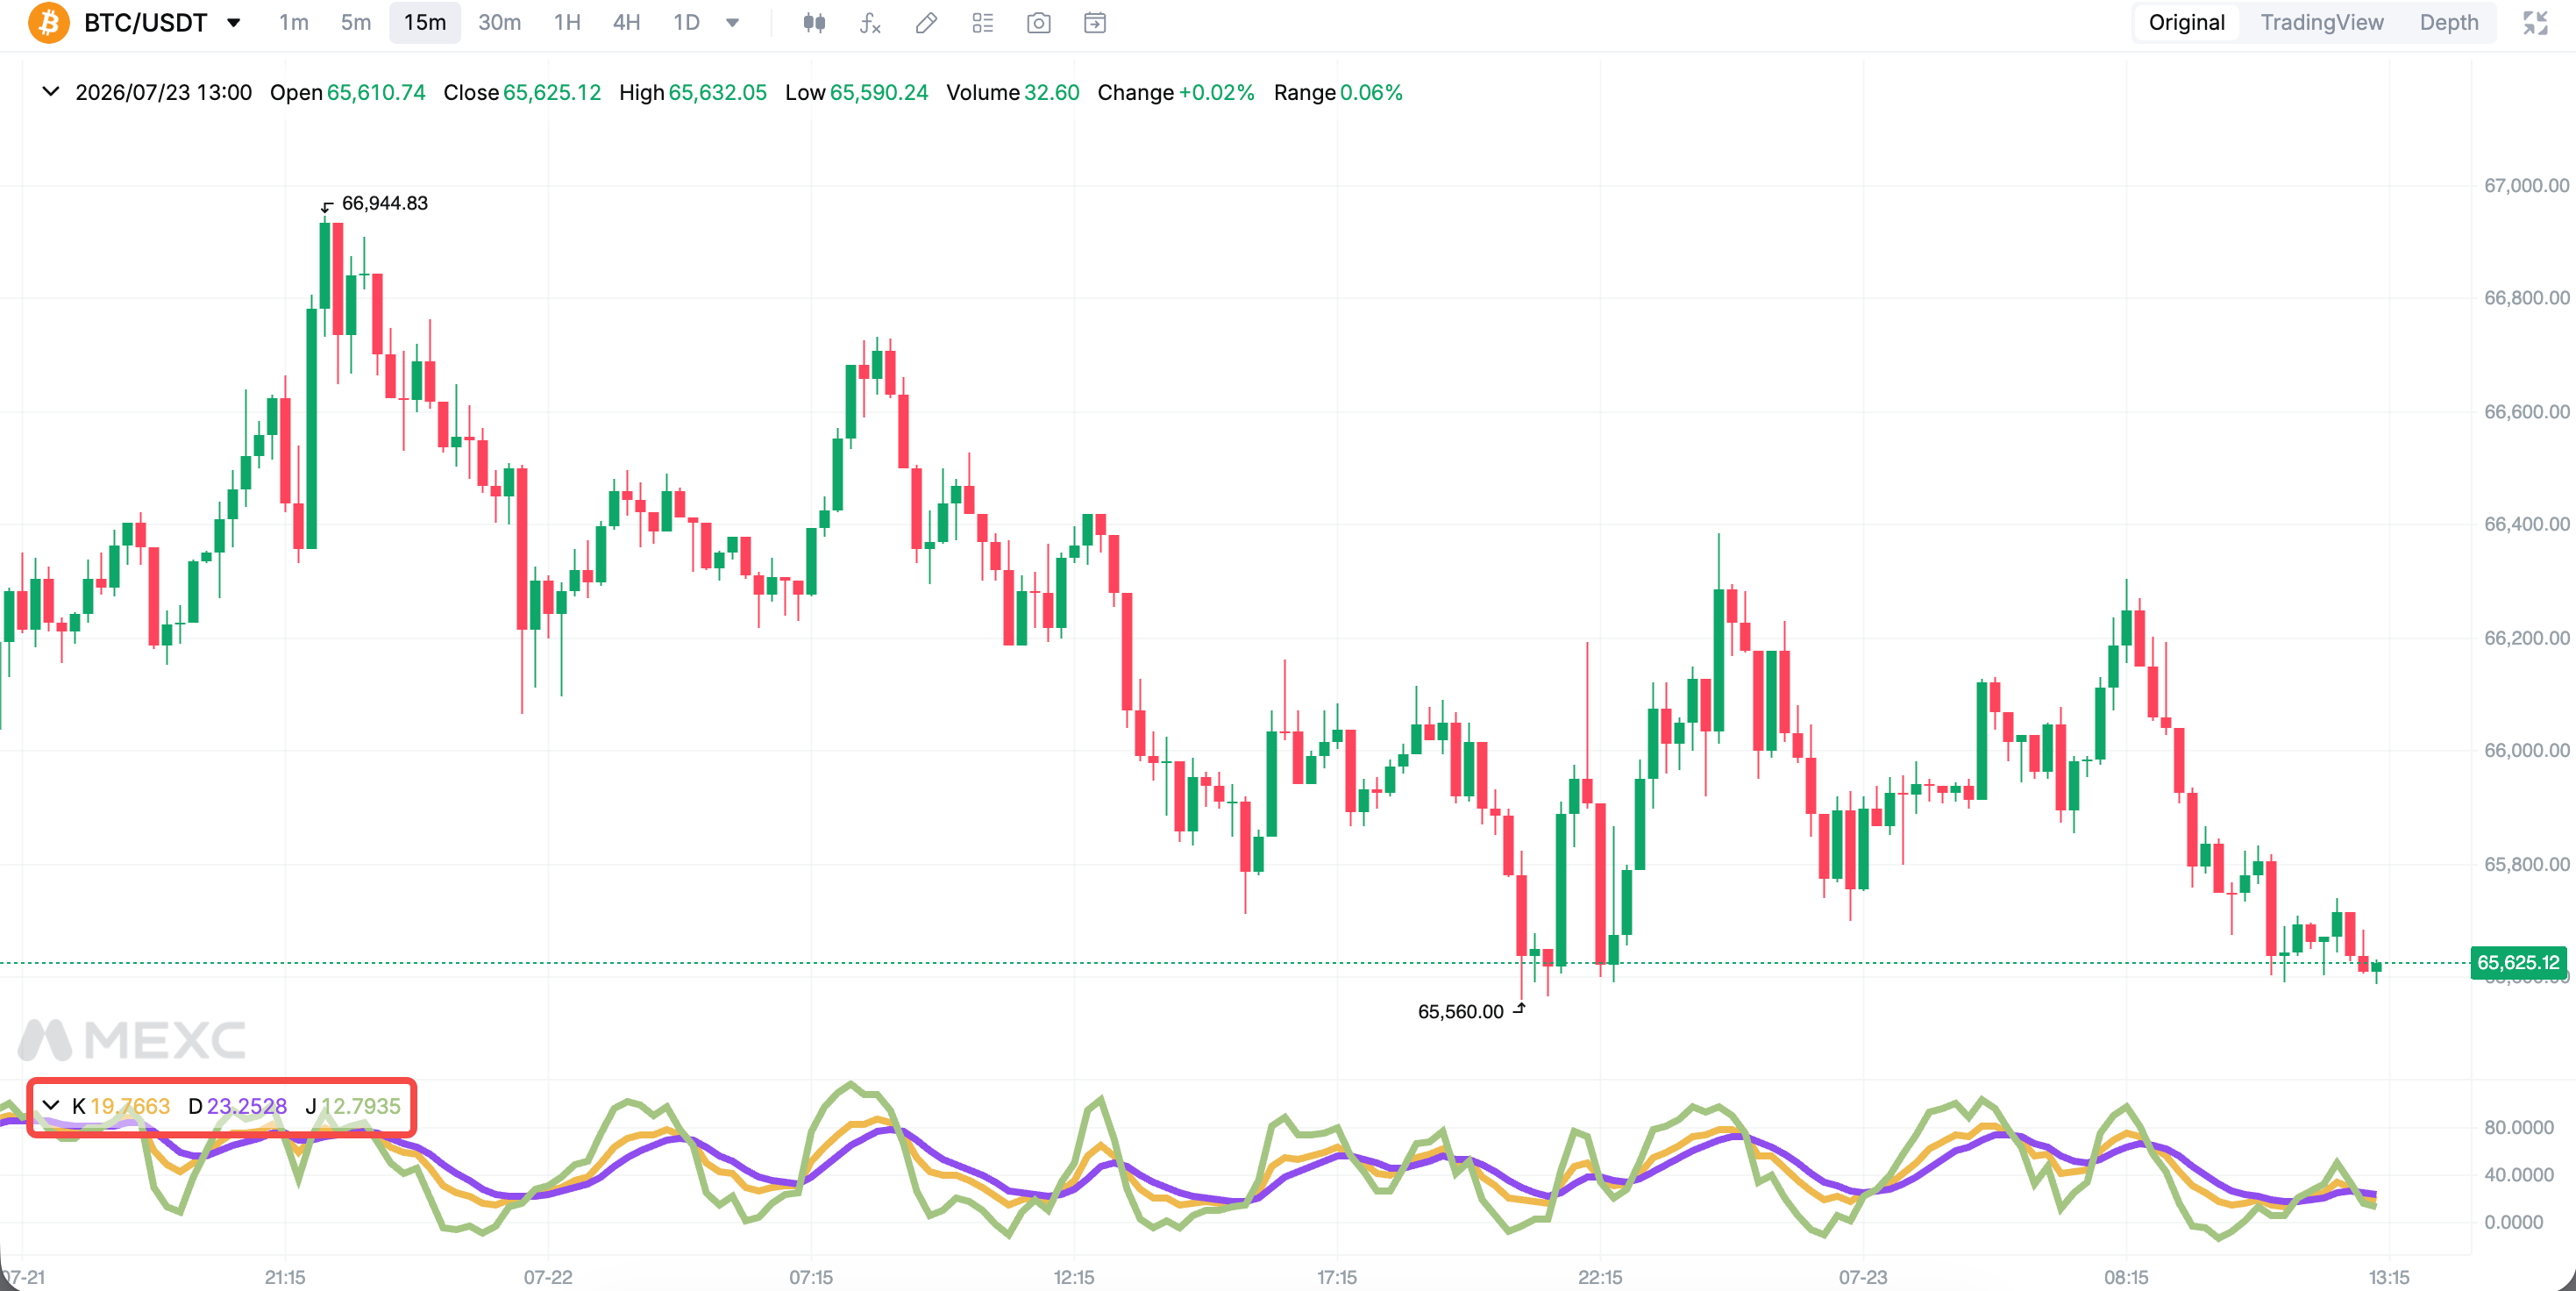
MEXC provides the KDJ version of the stochastic oscillator. It includes three lines: K is the faster line, D is a smoothed version of K, and J is derived from the K and D lines and reacts more sensitively to changes in momentum. Because the J line reacts more sharply, it may highlight changes in momentum earlier, but it can also be more volatile.
Traders often use KDJ to identify overbought or oversold conditions and potential turning points. However, these conditions are not automatic instructions to buy or sell. The broader trend, market structure, trading volume, and risk tolerance should also be considered.
2. How to Use KDJ: Core Trading Signals
2.1 Overbought and Oversold Conditions
K and D generally move between 0 and 100, while J may move beyond this range. Readings above 80 are commonly considered overbought, which may indicate that upward momentum is stretched. Readings below 20 are commonly considered oversold, which may indicate that downward momentum is stretched.
An overbought reading does not necessarily mean that the price will fall immediately, and an oversold reading does not guarantee a rebound. In a strong trend, KDJ may remain in an extreme zone for an extended period. Traders may wait for the indicator to leave the extreme zone, observe a crossover, and seek confirmation from price action or volume before making a decision.
J readings above 100 or below 0 may reflect particularly strong short-term momentum. These extreme readings can draw attention to a possible reversal, but they should not be used as standalone entry or exit signals.
2.2 Golden Crosses
A golden cross occurs when the K line crosses above the D line. This is generally considered a potential bullish signal because it suggests that short-term momentum is strengthening. A cross that forms below 20 may attract more attention because it occurs in the oversold zone.
The signal tends to be more useful when the broader trend is stable or turning upward and when trading volume supports the move. In a volatile or sideways market, repeated crossovers may produce false signals, so traders may wait for price confirmation before entering a position.
2.3 Death Crosses
A death cross occurs when the K line crosses below the D line. This is generally considered a potential bearish signal because it suggests that short-term momentum is weakening. A cross above 80 may carry more weight because it occurs in the overbought zone.
As with a golden cross, a death cross should be assessed in context. A single crossover may be unreliable during choppy trading. Traders may use trend indicators, support and resistance levels, and volume to determine whether the signal is confirmed.
2.4 Bullish and Bearish Divergences
A bearish divergence forms when the price reaches a higher high while KDJ forms a lower high. This may indicate that upward momentum is weakening. A bullish divergence forms when the price reaches a lower low while KDJ forms a higher low, which may indicate that selling momentum is fading.
Divergence can provide an early warning of a possible reversal, but it does not indicate exactly when a reversal will occur. Traders may wait for a confirmed break of market structure, a crossover, or stronger volume before acting on the signal.
3. How to Choose KDJ Settings
The standard KDJ parameters are (9, 3, 3). The first value is the lookback period, while the second and third values control the smoothing used for the K and D lines. The standard setting is suitable as a starting point for many short-term trading scenarios.
Short-term traders may use a setting such as (5, 3, 3) to make the indicator respond more quickly. This may reveal momentum changes earlier, but it can also create more noise and false signals. Swing traders may use a longer setting such as (14, 3, 3) to smooth short-term fluctuations, although the resulting signals may appear later.
There is no universally best KDJ setting. The appropriate choice depends on the asset, timeframe, market environment, and trading style. Traders can adjust the parameters on MEXC and compare the results with historical price action before using them in live trading.
4. How to Set Up KDJ on MEXC
Open the chart for a trading pair, select Indicators, and search for KDJ. Add the indicator to the chart, then open its settings to adjust the parameters for your preferred timeframe.
Beginners are advised to observe how golden crosses, death crosses, and overbought or oversold readings behave across different market conditions before relying on them in live trading. Consider starting with small amounts and using a stop-loss as part of a broader risk management plan.
5. Limitations and Confirmation Tools
KDJ may generate false signals when the market is highly volatile or moving sideways. During a strong directional trend, it may also remain overbought or oversold for an extended period. Selling solely because the indicator is above 80 or buying solely because it is below 20 may therefore lead to positions that run against the prevailing trend.
Moving averages: A moving average can help identify the broader trend. Traders may give greater weight to bullish KDJ signals when the price is above a rising moving average and to bearish signals when the price is below a falling moving average.
Relative Strength Index: RSI can provide an additional perspective on momentum and extreme market conditions. When KDJ and RSI point in the same direction, the signal may be more meaningful, but confirmation is still required.
Volume: Volume indicators can help assess whether a price move has sufficient participation. A breakout or reversal accompanied by stronger volume may be more significant than one that occurs on low volume.
No confirmation tool can eliminate market risk. Traders should define their invalidation level before entering a position, use position sizes that match their risk tolerance, and avoid relying on one indicator alone.
6. KDJ FAQ
6.1 What Is KDJ?
KDJ is a momentum oscillator derived from the stochastic oscillator. It consists of the K, D, and J lines and is used to assess the position of the latest closing price within a recent high-low range. Traders commonly use it to identify overbought or oversold conditions and possible changes in momentum.
6.2 Which KDJ Readings Should Traders Watch?
Readings above 80 are commonly treated as overbought, while readings below 20 are commonly treated as oversold. Some traders also monitor D readings above 70 or below 30. J readings above 100 or below 0 may reflect an extreme short-term condition. None of these levels guarantees a reversal, so traders should consider trend direction and seek confirmation.
6.3 Is KDJ Better Than Other Momentum Indicators?
No single momentum indicator is universally better. KDJ responds quickly and may be useful for short-term timing, while trend indicators are generally more suitable for evaluating the broader direction. Traders often combine them by using a trend indicator to establish context and KDJ to monitor possible entry or exit conditions.
6.4 What Are the Best KDJ Settings?
There is no universally best setting. The standard (9, 3, 3) setting is a practical starting point, while (5, 3, 3) may suit shorter-term analysis and (14, 3, 3) may provide smoother signals for swing trading. Traders should test settings against historical data and choose parameters that match their timeframe and risk tolerance.
Recommended Reading:
Risk Warning: Technical indicators are calculated using historical price or volume data and do not guarantee future market performance. Digital asset prices can be highly volatile, and trading involves risk. This article is for informational purposes only and does not constitute financial or investment advice. Users should make decisions based on their own financial circumstances, investment objectives, and risk tolerance.