Buy Crypto
Markets
Spot
FuturesBTC
Earn
Event Center
Rewards Hub
More
100%+ PoR
What Is a Shooting Star Candlestick? A Beginner's Guide to Identifying and Trading the PatternWhat Is a Shooting Star Candlestick? A Beginner's Guide to Identifying and Trading the Pattern
Category List
Cancel

What Is a Shooting Star Candlestick? A Beginner's Guide to Identifying and Trading the Pattern

Key Takeaways:

  • A shooting star is a potential bearish reversal pattern that forms near the top of an uptrend and may indicate weakening buying momentum.
  • Its key features are a small body, an upper wick at least twice the length of the body, and little or no lower wick.
  • A shooting star and an inverted hammer look similar, but they form in different trend contexts and have opposite directional implications.
  • When trading a shooting star pattern, use tools such as volume and the Relative Strength Index (RSI) to seek confirmation.
  • MEXC's candlestick charts help users identify shooting star patterns and incorporate them into their trading analysis.

1. What Is a Shooting Star Candlestick?


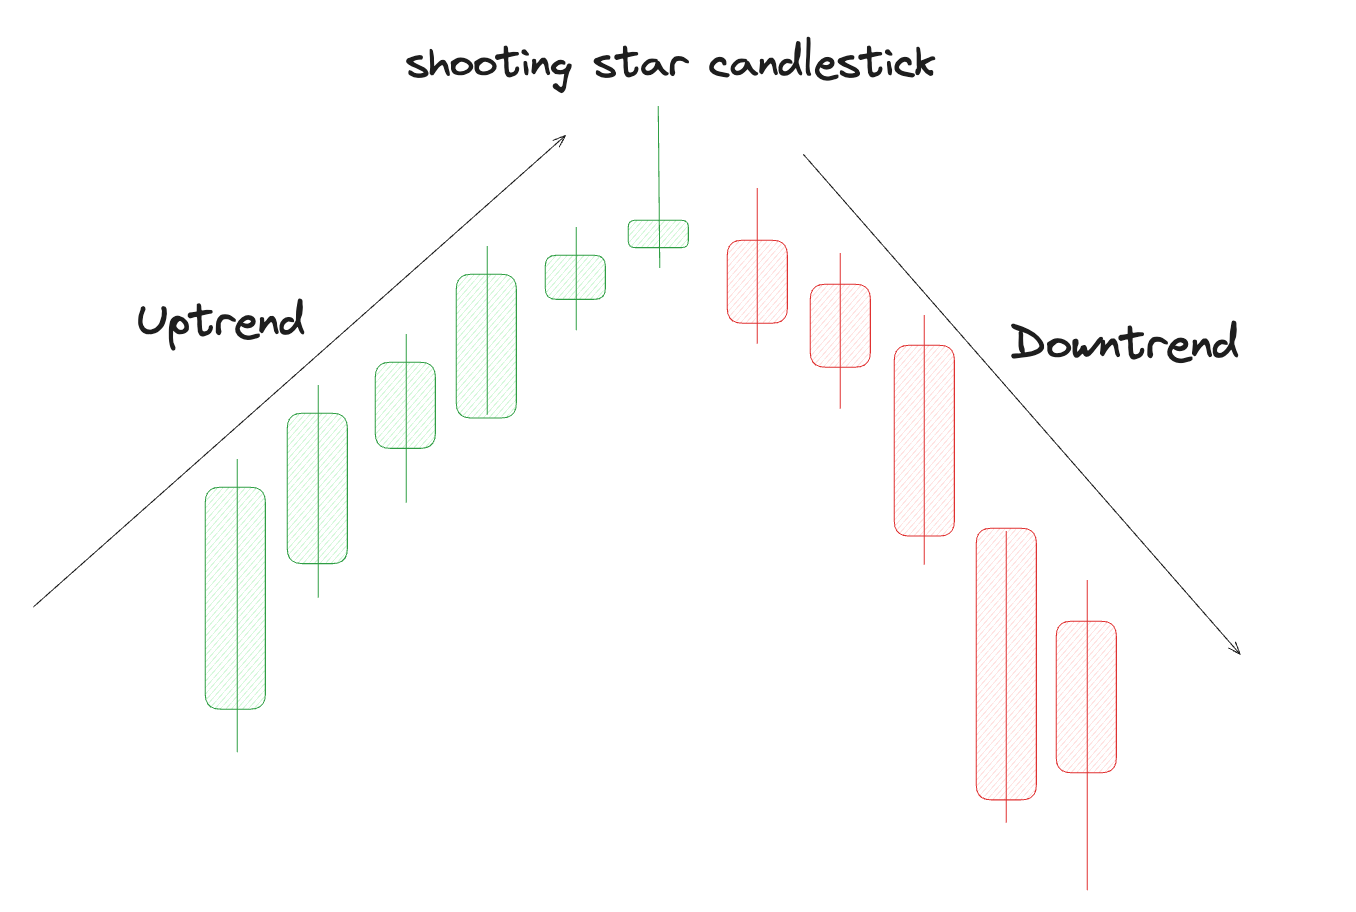
A shooting star is a commonly used potential bearish reversal pattern in technical analysis. It typically forms near the top of a pronounced uptrend. The pattern consists of a single candlestick with a small body near the bottom of its range, a long upper wick, and little or no lower wick. Its name comes from its resemblance to a meteor streaking across the night sky.

A shooting star forms when buyers initially extend the preceding rally and push prices sharply higher after the open. Selling pressure then builds, bringing the price back down to close near its opening level. The long upper wick records the failed attempt to sustain higher prices, suggesting that upward momentum may be weakening and a decline could follow.

On MEXC, users can visually identify shooting star patterns on candlestick charts and combine them with technical indicators for a broader analysis.

2. How to Identify a Shooting Star Candlestick


To identify a shooting star, look for the following key features:

1) It forms after an uptrend. The preceding trend is essential. The pattern has potential bearish reversal significance only after a sustained price rise. A similar-looking candle in a downtrend or sideways market is not classified as a shooting star.

2) It has a long upper wick. The upper wick should be at least twice the length of the body. It shows that buyers pushed the price higher, but most of those gains were lost before the close, suggesting significant selling pressure at higher levels.

3) It has a small body. The opening and closing prices are close together, with the body near the bottom of the candle's range. This may reflect indecision at higher prices and buyers' inability to sustain the rally.

4) It has little or no lower wick. This places the close near the period's low, adding to the indication of selling pressure.

3. Is There a Difference Between Green and Red Shooting Stars?


A shooting star can have either a green body, indicating a close above the open, or a red body, indicating a close below the open. In a green shooting star, the closing price is slightly higher than the opening price. In a red shooting star, it is lower.

Regardless of its body color, a shooting star is interpreted as a potential bearish signal. Even when the body is green, the long upper wick still shows rejection of higher prices. A red shooting star is generally considered more bearish because sellers not only reversed the gains made during the period but also pushed the price below the open.

4. Shooting Star vs. Inverted Hammer


A shooting star and an inverted hammer, sometimes informally called an inverted shooting star, look almost identical: both have small bodies and long upper wicks. This can be confusing for beginners. The key differences are the preceding trend and the direction of the potential reversal:

Pattern
Where It Forms
Signal
Shooting star
Near the top of an uptrend
Potential bearish reversal
Inverted hammer
Near the bottom of a downtrend
Potential bullish reversal


5. How to Trade a Shooting Star Pattern


After identifying a shooting star on MEXC, traders can consider the following steps:

1) Seek confirmation. A single candlestick does not show the full trend, so wait for follow-through. One commonly used confirmation is for the next candle to close below the shooting star's body. If the price instead breaks above the shooting star's high, the bearish setup is invalidated. Higher volume when the pattern forms may strengthen the signal.

2) Use other technical indicators. Check whether the Relative Strength Index (RSI) is above 70, a level commonly associated with overbought conditions, or whether Moving Average Convergence Divergence (MACD) shows a bearish crossover. A shooting star near a key resistance level may strengthen the case for a potential reversal.

3) Plan entry and exit levels. A more cautious approach is to wait for the price to break below the shooting star's low before entering a short position, or to enter after the confirmation candle closes. Key support levels below the price or Fibonacci retracement levels can serve as references for take-profit targets.

4) Apply risk management. A stop-loss may be placed above the shooting star's high to help limit losses if the pattern fails and the uptrend continues. Keep position sizes appropriate to avoid taking excessive risk on a single trade.

6. Limitations of the Shooting Star Pattern


Although a shooting star can warn of a potential market top, traders should recognize its limitations:

1) A shooting star may reflect market noise rather than a lasting reversal. This is especially relevant in a strong uptrend, where renewed buying can quickly absorb temporary selling pressure.

2) The pattern depends heavily on market context and is less useful in a sideways market.

3) A shooting star does not provide a specific profit target on its own. Tools such as support-level analysis are needed to help plan exits.

When trading on MEXC, combine shooting stars with volume analysis, trend assessment, and support and resistance levels. Use stop-loss orders as part of your risk management, and avoid acting on a single pattern alone.


7. Shooting Star Candlestick FAQs


7.1 What does a shooting star candlestick mean?


A shooting star is a single-candle pattern that forms near the top of an uptrend, with a small body and a long upper wick. It suggests that buyers failed to sustain higher prices and selling pressure increased, raising the possibility of a shift from an uptrend to a decline.

7.2 Is a shooting star bullish or bearish?


A shooting star is a bearish reversal signal. It forms after a rally and may indicate weakening upward momentum, with a pullback or trend reversal potentially ahead.

7.3 What does a red shooting star mean?


A red shooting star closes below its opening price. It is generally interpreted as more bearish than a green shooting star because sellers not only reversed the gains made during the period but also pushed the price below the open.

7.4 What is the difference between a shooting star and an inverted hammer?


The two patterns look similar, but a shooting star forms near the top of an uptrend and signals a potential bearish reversal. An inverted hammer forms near the bottom of a downtrend and signals a potential bullish reversal. The key distinction is the direction of the preceding trend.

7.5 Can a shooting star be bullish?


Strictly speaking, no. Even if the candle has a green body and closes above its open, the long upper wick still shows rejection of higher prices. The shooting star therefore retains its bearish interpretation.

7.6 What does a double shooting star pattern mean?


A double shooting star consists of two consecutive shooting star candles near the top of an uptrend. It suggests that buyers failed twice to sustain higher prices, which may be a stronger warning of a potential reversal than a single shooting star.

7.7 How can I confirm a shooting star signal?


Common confirmation factors include the next candle closing below the shooting star's body, higher volume when the pattern forms, RSI readings in overbought territory, and the pattern appearing near a key resistance level. The more factors align, the stronger the signal.

What Is a Shooting Star Candlestick? A Beginner's Guide to Identifying and Trading the Pattern

Key Takeaways:

  • A shooting star is a potential bearish reversal pattern that forms near the top of an uptrend and may indicate weakening buying momentum.
  • Its key features are a small body, an upper wick at least twice the length of the body, and little or no lower wick.
  • A shooting star and an inverted hammer look similar, but they form in different trend contexts and have opposite directional implications.
  • When trading a shooting star pattern, use tools such as volume and the Relative Strength Index (RSI) to seek confirmation.
  • MEXC's candlestick charts help users identify shooting star patterns and incorporate them into their trading analysis.

1. What Is a Shooting Star Candlestick?


A shooting star is a commonly used potential bearish reversal pattern in technical analysis. It typically forms near the top of a pronounced uptrend. The pattern consists of a single candlestick with a small body near the bottom of its range, a long upper wick, and little or no lower wick. Its name comes from its resemblance to a meteor streaking across the night sky.

A shooting star forms when buyers initially extend the preceding rally and push prices sharply higher after the open. Selling pressure then builds, bringing the price back down to close near its opening level. The long upper wick records the failed attempt to sustain higher prices, suggesting that upward momentum may be weakening and a decline could follow.

On MEXC, users can visually identify shooting star patterns on candlestick charts and combine them with technical indicators for a broader analysis.

2. How to Identify a Shooting Star Candlestick


To identify a shooting star, look for the following key features:

1) It forms after an uptrend. The preceding trend is essential. The pattern has potential bearish reversal significance only after a sustained price rise. A similar-looking candle in a downtrend or sideways market is not classified as a shooting star.

2) It has a long upper wick. The upper wick should be at least twice the length of the body. It shows that buyers pushed the price higher, but most of those gains were lost before the close, suggesting significant selling pressure at higher levels.

3) It has a small body. The opening and closing prices are close together, with the body near the bottom of the candle's range. This may reflect indecision at higher prices and buyers' inability to sustain the rally.

4) It has little or no lower wick. This places the close near the period's low, adding to the indication of selling pressure.


3. Is There a Difference Between Green and Red Shooting Stars?


A shooting star can have either a green body, indicating a close above the open, or a red body, indicating a close below the open. In a green shooting star, the closing price is slightly higher than the opening price. In a red shooting star, it is lower.

Regardless of its body color, a shooting star is interpreted as a potential bearish signal. Even when the body is green, the long upper wick still shows rejection of higher prices. A red shooting star is generally considered more bearish because sellers not only reversed the gains made during the period but also pushed the price below the open.

4. Shooting Star vs. Inverted Hammer


A shooting star and an inverted hammer, sometimes informally called an inverted shooting star, look almost identical: both have small bodies and long upper wicks. This can be confusing for beginners. The key differences are the preceding trend and the direction of the potential reversal:

Pattern
Where It Forms
Signal
Shooting star
Near the top of an uptrend
Potential bearish reversal
Inverted hammer
Near the bottom of a downtrend
Potential bullish reversal


5. How to Trade a Shooting Star Pattern


After identifying a shooting star on MEXC, traders can consider the following steps:

1) Seek confirmation. A single candlestick does not show the full trend, so wait for follow-through. One commonly used confirmation is for the next candle to close below the shooting star's body. If the price instead breaks above the shooting star's high, the bearish setup is invalidated. Higher volume when the pattern forms may strengthen the signal.

2) Use other technical indicators. Check whether the Relative Strength Index (RSI) is above 70, a level commonly associated with overbought conditions, or whether Moving Average Convergence Divergence (MACD) shows a bearish crossover. A shooting star near a key resistance level may strengthen the case for a potential reversal.

3) Plan entry and exit levels. A more cautious approach is to wait for the price to break below the shooting star's low before entering a short position, or to enter after the confirmation candle closes. Key support levels below the price or Fibonacci retracement levels can serve as references for take-profit targets.

4) Apply risk management. A stop-loss may be placed above the shooting star's high to help limit losses if the pattern fails and the uptrend continues. Keep position sizes appropriate to avoid taking excessive risk on a single trade.

6. Limitations of the Shooting Star Pattern


Although a shooting star can warn of a potential market top, traders should recognize its limitations:

1) A shooting star may reflect market noise rather than a lasting reversal. This is especially relevant in a strong uptrend, where renewed buying can quickly absorb temporary selling pressure.

2) The pattern depends heavily on market context and is less useful in a sideways market.

3) A shooting star does not provide a specific profit target on its own. Tools such as support-level analysis are needed to help plan exits.

When trading on MEXC, combine shooting stars with volume analysis, trend assessment, and support and resistance levels. Use stop-loss orders as part of your risk management, and avoid acting on a single pattern alone.


7. Shooting Star Candlestick FAQs


7.1 What does a shooting star candlestick mean?


A shooting star is a single-candle pattern that forms near the top of an uptrend, with a small body and a long upper wick. It suggests that buyers failed to sustain higher prices and selling pressure increased, raising the possibility of a shift from an uptrend to a decline.

7.2 Is a shooting star bullish or bearish?


A shooting star is a bearish reversal signal. It forms after a rally and may indicate weakening upward momentum, with a pullback or trend reversal potentially ahead.

7.3 What does a red shooting star mean?


A red shooting star closes below its opening price. It is generally interpreted as more bearish than a green shooting star because sellers not only reversed the gains made during the period but also pushed the price below the open.

7.4 What is the difference between a shooting star and an inverted hammer?


The two patterns look similar, but a shooting star forms near the top of an uptrend and signals a potential bearish reversal. An inverted hammer forms near the bottom of a downtrend and signals a potential bullish reversal. The key distinction is the direction of the preceding trend.

7.5 Can a shooting star be bullish?


Strictly speaking, no. Even if the candle has a green body and closes above its open, the long upper wick still shows rejection of higher prices. The shooting star therefore retains its bearish interpretation.

7.6 What does a double shooting star pattern mean?


A double shooting star consists of two consecutive shooting star candles near the top of an uptrend. It suggests that buyers failed twice to sustain higher prices, which may be a stronger warning of a potential reversal than a single shooting star.

7.7 How can I confirm a shooting star signal?


Common confirmation factors include the next candle closing below the shooting star's body, higher volume when the pattern forms, RSI readings in overbought territory, and the pattern appearing near a key resistance level. The more factors align, the stronger the signal.