

Liquidation
Share
Liquidation occurs when a trader’s collateral is no longer sufficient to cover their leveraged position’s losses, triggering an automated forced closure by the exchange's liquidation engine. It is a critical risk-management mechanism that ensures the solvency of lending protocols and derivative platforms. In 2026, the focus has moved toward MEV-resistant liquidation models that protect users from predatory "cascades." This tag provides essential information on maintenance margins, health factors, and how to avoid liquidation in high-volatility environments.
15279 Articles
Created: 2026/02/02 18:52
Updated: 2026/02/02 18:52


Recommended by active authors

Latest Articles

Next 1000x Meme Coin Signal: APEMARS Stage 7 Tops Best Crypto to Buy Today With 9763% Upside While SHIB, FARTCOIN Lag
2026/02/08 08:15

Top Altcoin Picks: Origin Expands Ecosystem, and Maker Strengthens DeFi While APEMARS Lead as Next Crypto To Hit $1 With 9,700% ROI
2026/02/08 08:15

Savannah Guthrie communicates with mom's kidnappers in new vid: 'We received your message'
2026/02/08 08:13

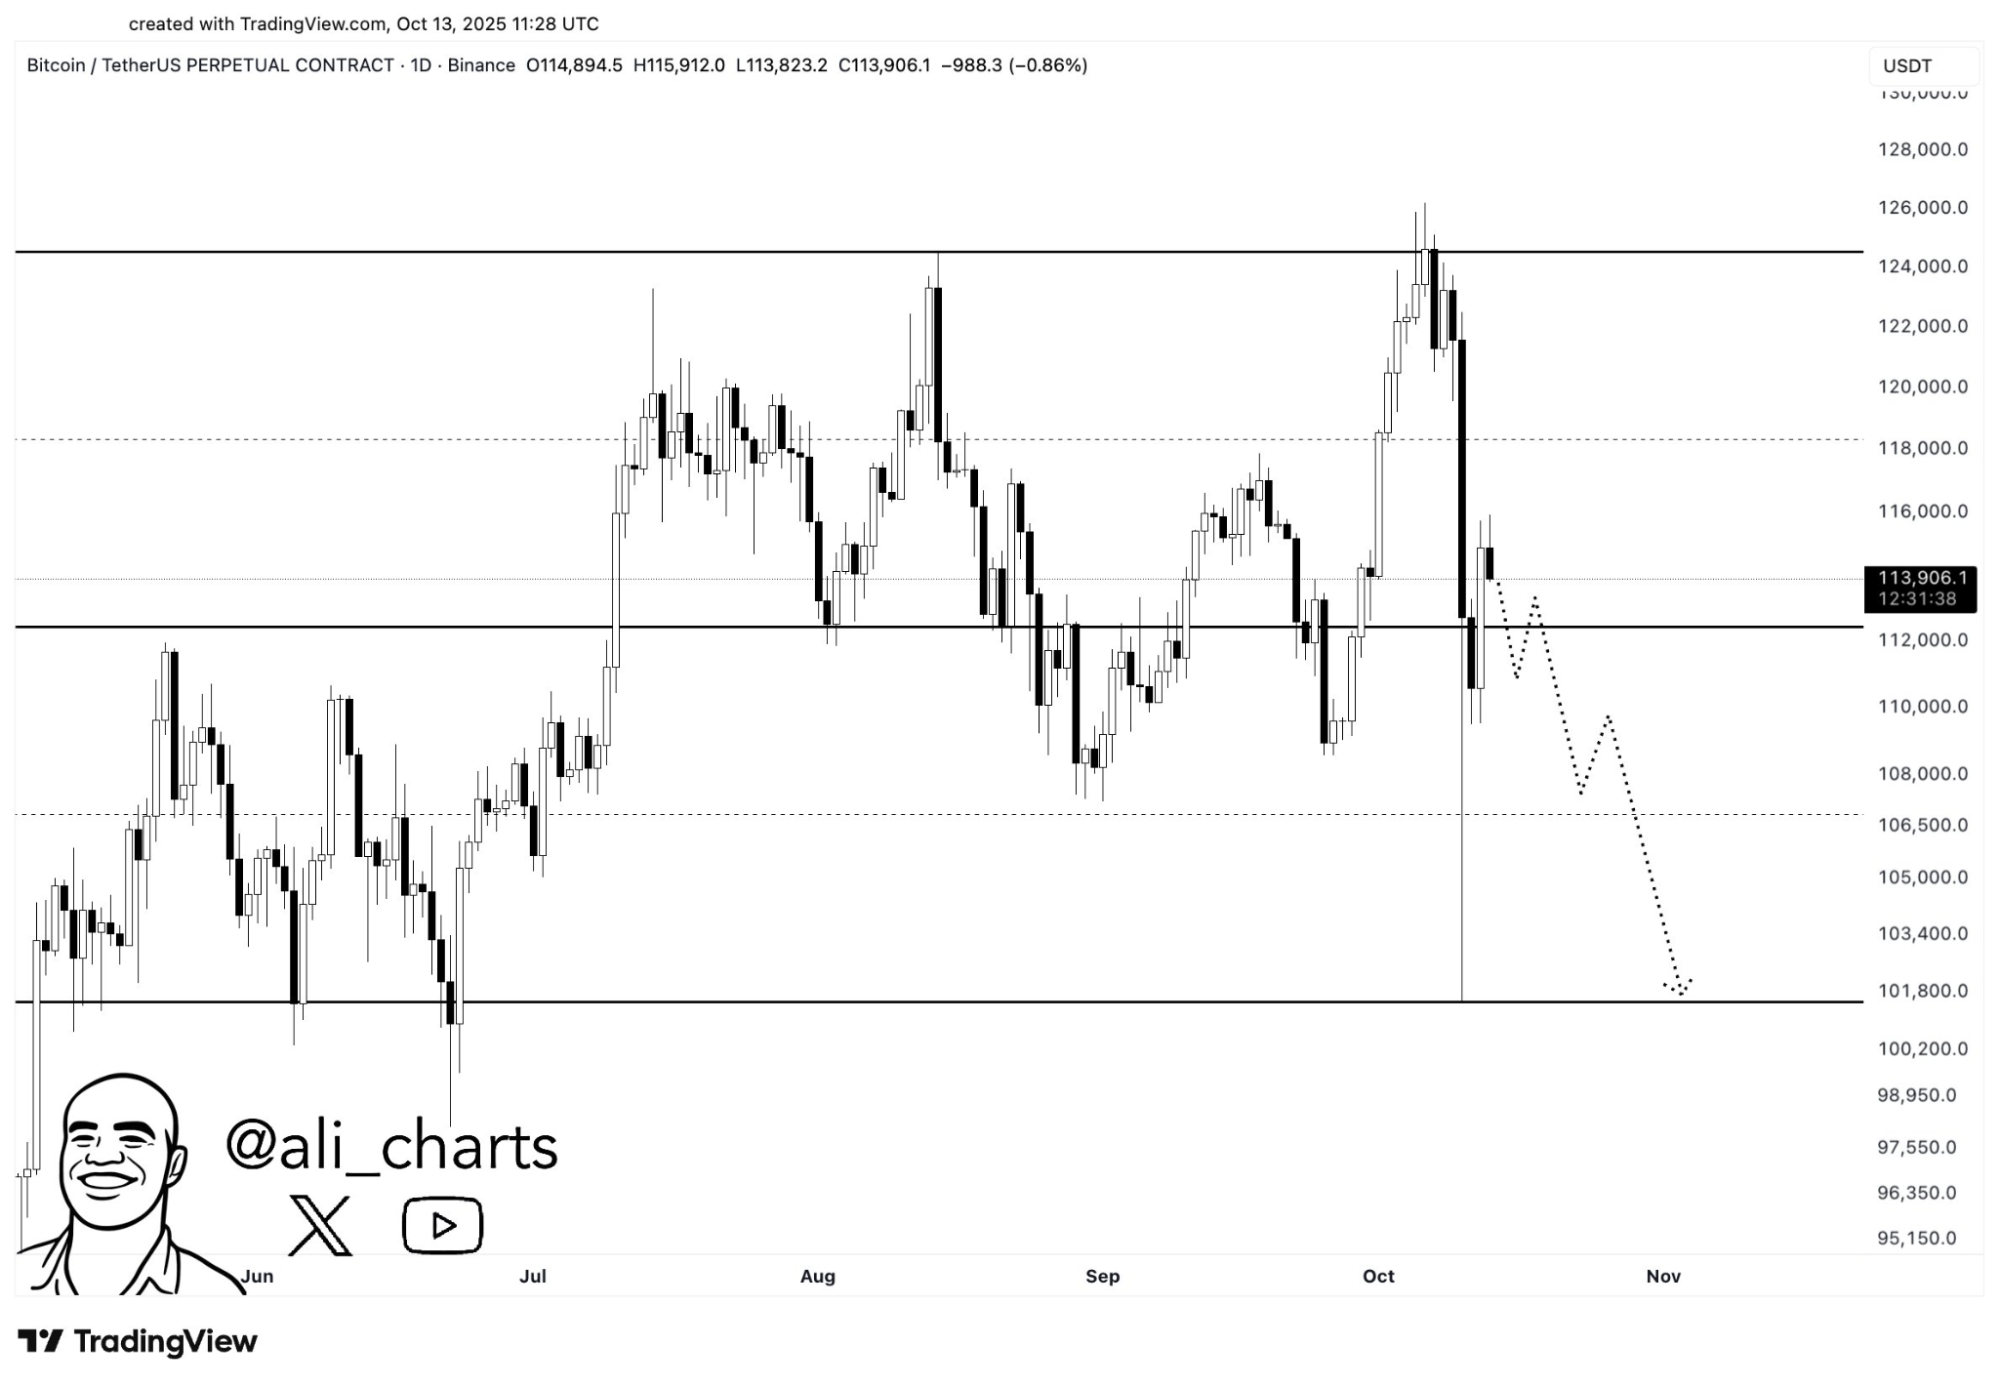
Trading volume for BTC and ETH surged unusually in the early hours of the morning, causing sharp price fluctuations in a short period.
2026/02/08 08:02

Galaxy Digital Authorizes $200M Share Buyback as Stock Rebounds
2026/02/08 07:30