

SUI Breaks Descending Channel As Volume Surge Fuels Bullish Continuation
SUI breaks above daily descending channel resistance with expanding volume, as traders track $1.95 to $4.20 targets.
SUI is back in focus after breaking above descending channel resistance on the daily chart.
The move came with reported expanding volume, while the token traded near $1.2112 after a 2.20% daily decline.
Traders are now watching whether SUI can hold its recovery structure and move toward higher targets at $1.95, $2.40, $3.10, and $4.20.
SUI Breaks Daily Descending Channel
SUI has moved above descending channel resistance on the daily timeframe. This channel had limited price recovery during recent market weakness.
However, the latest breakout has shifted attention back to buyers. The move was supported by expanding volume, according to the chart setup.
Rising volume often shows stronger market activity during a breakout. It can also help traders assess whether price strength has wider support.
The breakout has already delivered a reported fixed profit of 46%. Even so, the token remains below past major highs from late 2024 and 2025.
This keeps the current move inside a wider recovery phase. SUI is trading near $1.2112 after slipping 2.20% in the current session.
The token recently bounced from its lower 2026 range. As a result, traders are watching whether buyers can defend the breakout area.
Key Price Levels Shape SUI’s Next Move
The next upside targets for SUI are $1.95, $2.40, $3.10, and $4.20. These levels may act as resistance if the recovery continues.
Each target could attract profit-taking from short-term traders. Before those targets, SUI must clear nearer resistance.
The first major area sits around $1.30 to $1.35. A daily close above this zone could support a move toward $1.50.
After that, the $1.80 area may become the next test. This level sits below the larger target at $1.95. Therefore, buyers may need steady volume to extend the move.
Support remains important during the recovery. The first key support sits near $1.10. A wider support zone is also visible around $1.00.
CoinMarketCap data shows SUI trading at $1.21, down 3.23% over 24 hours. Its market cap stands at $4.85 billion, while the unlocked market cap is also listed at $4.85 billion.
The 24-hour volume is around $692.3 million, after falling 31.62%. However, the volume-to-market-cap ratio remains at 14.27%, showing active trading compared with SUI’s market size.
SUI has a fully diluted valuation of $12.1 billion. Its total and maximum supply are both 10 billion SUI, while circulating supply is shown at 4 billion SUI.
Read Also:
Technical Picture Shows Recovery Attempt
The daily RSI is near 67, while its signal line is close to 60. This reading shows strong buying pressure on the daily chart. However, it also places SUI near overbought territory.
If RSI moves above 70, traders may watch for a pause. A short pullback could happen if momentum becomes stretched. Still, the current RSI reading supports the breakout structure.
 SUI daily chart shows price recovery, RSI, and MACD. Source: TradingView
The MACD also shows a positive setup. The MACD line remains above the signal line.
Meanwhile, the histogram is positive, which supports active bullish momentum. SUI’s recovery remains tied to support and resistance levels.
Holding above $1.10 and $1.00 would keep the setup stable. A close above $1.35 could strengthen the path toward $1.50 and $1.95.
The post SUI Breaks Descending Channel As Volume Surge Fuels Bullish Continuation appeared first on Live Bitcoin News.


Ayrıca Şunları da Beğenebilirsiniz
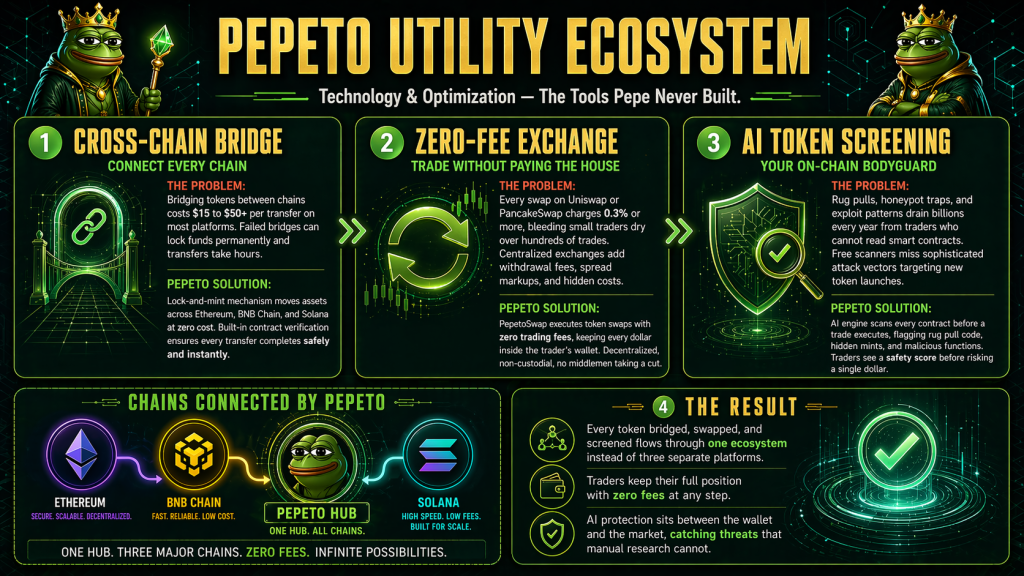
Which Are the Top 3 Cryptos to Buy Now as Solana Lands Mastercard and Pepeto Presale Nears Sold-Out Close
Ondas (ONDS) Stock Soars After Revenue Explodes Over 1,000% in Q1 2026


