

XRP Price Faces Deeper Pullback as Analysts Track $0.70 Support Zone
Key Insights:
- EGRAG Crypto says XRP’s loss of the monthly 50 EMA could draw price toward the 100 EMA.
- XRP crypto dominance is weakening after a breakdown below long-term triangle support.
- Analysts identify $1.09, $0.92, $0.85, and $0.70 as possible accumulation zones.
XRP price remains under intense pressure as analysts assess whether the current decline reflects capitulation or a wider structural breakdown. Monthly charts show the token trading near $1.14 after losing several important technical levels.
Analysts have presented different parts of the same broader setup. One focuses on monthly moving averages and potential downside zones, while the other tracks weakening market dominance and long-term support.
XRP Price Loses Its Monthly 50 EMA
EGRAG Crypto said XRP price has moved decisively below its monthly 50 EMA after losing momentum near the $3 region. Similar breaks in previous cycles often preceded a deeper move toward the monthly 100 EMA.
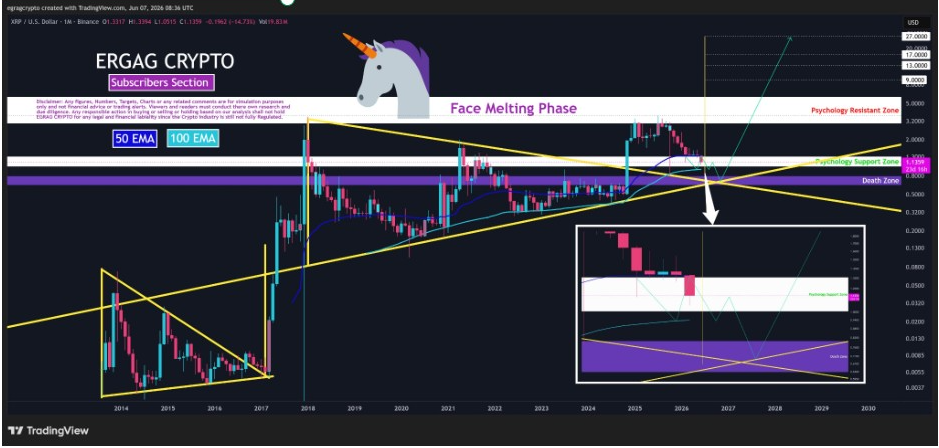 XRPUSD Monthly Chart | Source: EGRAG Crypto, X
That average currently sits near $0.90. EGRAG identified possible accumulation levels around $1.09, $0.92, $0.85, and below $0.70 as XRP searches for a stronger long-term floor.
His chart placed XRP price inside a broad psychological support area stretching from roughly $0.80 to $1.20. A lower “death zone” appears near $0.60 to $0.80, where the price could meet a rising multi-year trendline.
EGRAG described the possible decline as an emotional capitulation phase that may occur before another expansion. However, XRP must first protect its broader support structure before any long-term recovery becomes credible.
A sustained monthly close below the 50 EMA would preserve bearish pressure. In contrast, a recovery above that average could reduce the likelihood of a full decline toward the 100 EMA.
XRP Crypto Dominance Signals Further Weakness
Additionally, ChartNerd noted that XRP’s share of the wider crypto market is weakening after failing beneath a seven-year resistance area. XRP dominance currently stands near 3.33%, according to the shared chart.
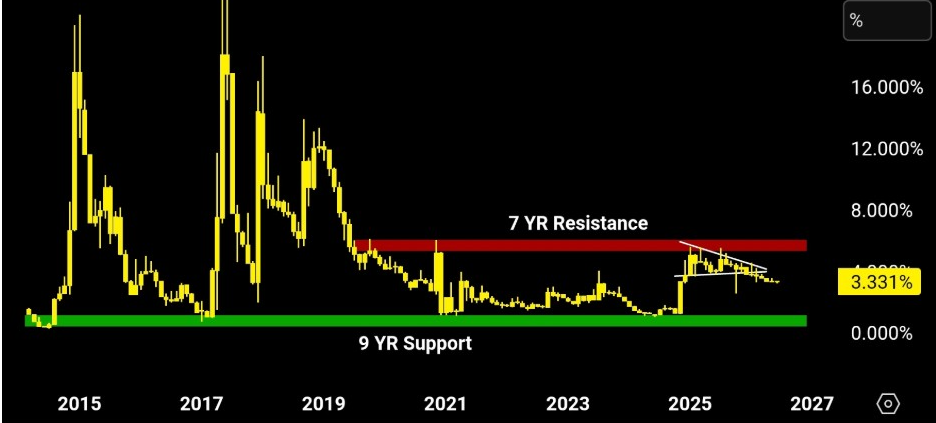 XRP Dominance Signals Further Decline | Source: ChartNerd, X
The structure shows two confirmed reactions from long-term resistance before price dominance broke below triangle support. ChartNerd warned that continued underperformance could pull XRP dominance toward a nine-year support region near 1.1%.
Falling dominance means XRP crypto may continue lagging other cryptocurrencies even if its dollar price stabilizes. Therefore, market participants are watching both XRP’s direct price action and its relative strength across the crypto market.
ChartNerd’s chart showed that XRP entered an extended consolidation phase after reaching similar resistance levels. Another decline toward the lower dominance boundary would indicate further capital rotation away from XRP.
Nevertheless, dominance remains above its historical base. A reversal before reaching 1.1% could preserve the broader range and signal that selling pressure is beginning to fade.
Analysts Compare XRP Price With Amazon’s Setup
However, ChartNerd remains constructive on XRP’s longer-term structure. One comparison places XRP beside Amazon’s decade-long consolidation before the stock eventually broke above major resistance.
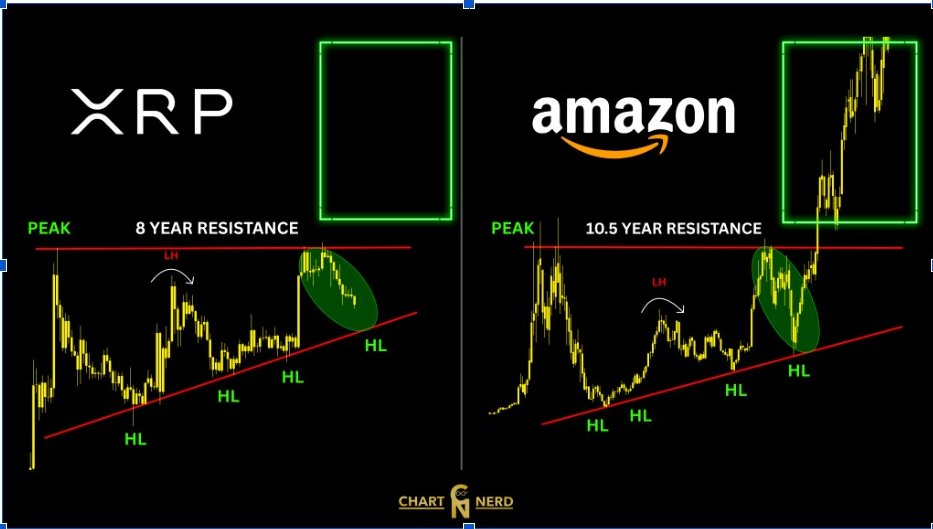
XRP Vs Amazon | Source: X
Both charts show repeated higher lows forming beneath a long-standing horizontal ceiling. Amazon later returned to rising support, cleared resistance, and entered a strong expansion phase.
ChartNerd stressed that the comparison is technical rather than a guaranteed forecast. Similar chart structures do not ensure that XRP will repeat Amazon’s long-term performance.
Another ChartNerd model identifies recurring XRP crypto cycles marked by a breakout, rounded consolidation, and renewed expansion from multi-year ascending support. Under that framework, the current decline may represent the final part of another corrective curve.
The chart projects a possible future move toward levels between $13 and $27 after a confirmed breakout. These remain highly speculative targets and depend on XRP defending its rising support structure.
The post XRP Price Faces Deeper Pullback as Analysts Track $0.70 Support Zone appeared first on The Market Periodical.


Ayrıca Şunları da Beğenebilirsiniz
World Cup Memecoin WORLDCUP Surges 130% Ahead of June Tournament
Yuga Labs rescues 68 NFTs after Flooring Protocol exploit

What Will Happen Before GTA VI Prediction 2026: GPT-6 Release, Trump Presidency, or Drake’s Iceman?


Popüler Haberler
Daha fazla
