

XRP Price Climbs Off Recent Lows With Fresh Upside Momentum
XRP price started a recovery wave above $1.10 and $1.1250. The price is now consolidating and might aim for a fresh move if it clears $1.1730.
- XRP price started a recovery wave above the $1.1250 zone.
- The price is now trading below $1.1220 and the 100-hourly Simple Moving Average.
- There was a break above a bearish trend line with resistance at $1.10 on the hourly chart of the XRP/USD pair (data source from Kraken).
- The pair could continue to move up if it settles above $1.1250.
XRP Price Eyes More Gains
XRP price remained supported above $1.050 and started a recovery wave, like Bitcoin and Ethereum. The price was able to climb above $1.10 and $1.120 to enter a short-term positive zone.
There was a break above a bearish trend line with resistance at $1.10 on the hourly chart of the XRP/USD pair. The bulls pushed the price above the 23.6% Fib retracement level of the downward move from the $1.3640 swing high to the $1.052 swing low.
The price is now trading above $1.120 and the 100-hourly Simple Moving Average. If there is a fresh upward move, the price might face resistance near the $1.1720 level. The first major resistance is near the $1.2080 level and the 50% Fib retracement level of the downward move from the $1.3640 swing high to the $1.052 swing low.
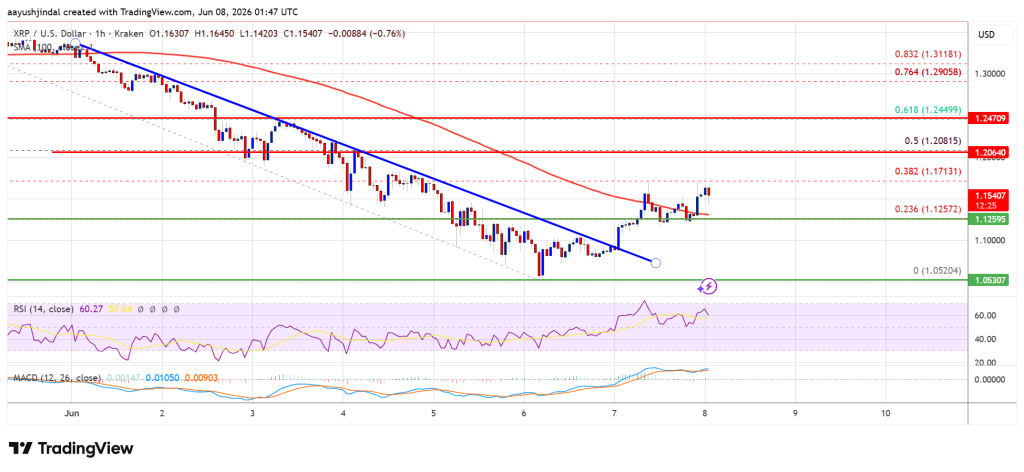
A close above $1.2080 could send the price to $1.2150. The next hurdle sits at $1.220. A clear move above the $1.220 resistance might send the price toward the $1.2450 resistance. Any more gains might send the price toward the $1.2620 resistance.
Another Decline?
If XRP fails to clear the $1.1740 resistance zone, it could start a fresh decline. Initial support on the downside is near the $1.1250 level. The next major support is near the $1.110 level.
If there is a downside break and a close below the $1.110 level, the price might continue to decline toward $1.080. The next major support sits near the $1.050 zone, below which the price could continue lower toward $1.00.
Technical Indicators
Hourly MACD – The MACD for XRP/USD is now gaining pace in the bullish zone.
Hourly RSI (Relative Strength Index) – The RSI for XRP/USD is now above the 50 level.
Major Support Levels – $1.1250 and $1.1200.
Major Resistance Levels – $1740 and $1.2080.


Ayrıca Şunları da Beğenebilirsiniz
Indian Rupee Plunges as Israel-Iran Tensions Spike and Fed Hawkishness Intensifies

Gold Spot Volume on Binance Surges to $80M as Demand Extends Beyond Futures

Best Free Social Media Tools for Growth & Engagement in 2026


Popüler Haberler
Daha fazla
