

After 5 Years of Pain, Altcoins Just Flashed the Same Signal as 2020
Altcoins have been stuck in the shadow of Bitcoin for years. Since the 2021 cycle peak, altcoin dominance has been in a steady downtrend.
Every rally attempt failed. Every breakout faded. Capital kept flowing back into BTC. For many investors, it has felt like a long grind with no real relief.
But now, one chart is starting to look very different.
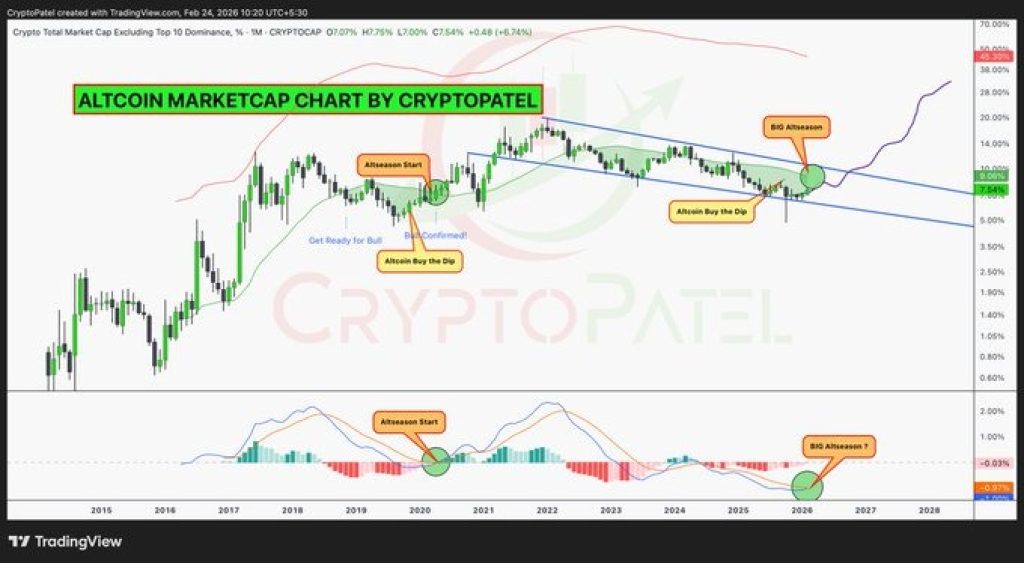
Crypto Patel shared a long-term altcoin dominance chart that shows a five-year descending trendline nearing a break.
More importantly, the MACD on the higher timeframe is about to print a bullish cross, the same type of signal that appeared before the 2020–2021 altcoin explosion.
Looking at the chart, altcoin dominance has respected a falling resistance line since the previous cycle high. Every time dominance pushed into that trendline, sellers stepped in.
Now price is pressing against it again. The structure shows repeated higher lows forming near support while resistance has remained flat.
That compression matters. When a market spends years building pressure under a descending line, the eventual break can be aggressive.
The chart even highlights previous “altseason start” zones in 2017 and 2020. Both were preceded by similar compression phases.
 Source: X/CryptoPatel
However, below the chart, the MACD indicator is turning higher.
In both 2017 and 2020, a bullish MACD cross on the higher timeframe aligned with altcoin dominance breaking upward. What followed were massive expansions across the alt market, with many coins posting 10x to 20x moves.
Right now, the MACD is curling up again.
Volatility has been contracting for months. Dominance is sitting near a key inflection point. Liquidity appears to be building above current levels. This type of setup does not guarantee an explosion, but historically, this is how they begin.
Read Also: Pi Network Posts Record Growth Metrics, So Why Does the Pi Coin Chart Look Dead?
However, Altcoin dominance represents how much of the total crypto market cap is allocated outside of Bitcoin. When dominance rises, it means capital is rotating into altcoins.
For years, Bitcoin has controlled the narrative. But if dominance breaks this five-year trendline, it would signal a shift in market structure.
That shift is what traders call “altseason.”
It does not happen overnight. It starts quietly, often when sentiment is still skeptical.
Early or Late?
The chart does not promise 20x moves. Markets do not repeat perfectly.
But the technical structure looks similar to previous cycle turning points. A multi-year downtrend is being tested. Momentum is turning. Compression is extreme.
If dominance breaks and holds above resistance, the rotation into altcoins could accelerate quickly. After five years of underperformance, altcoins are back at a decision point.
Whether this becomes the next explosive phase or another fakeout depends on one thing: can dominance finally close above that long-standing resistance?
If it does, the market structure changes.
Subscribe to our YouTube channel for daily crypto updates, market insights, and expert analysis.
The post After 5 Years of Pain, Altcoins Just Flashed the Same Signal as 2020 appeared first on CaptainAltcoin.
Ayrıca Şunları da Beğenebilirsiniz

U.S. Moves Grip on Crypto Regulation Intensifies

SEC Grants WisdomTree Relief for 24/7 Trading of Tokenized Fund Shares
