

Analyst to XRP Traders: This Is Where the Reaction Should Be Taking Place
XRP is currently testing critical support near $1.33, potentially forming a higher low. Crypto analyst ChartNerd (@ChartNerdTA) highlighted this in a recent post, noting that the price is retracing toward a Fibonacci demand pocket between the 0.5 and 0.618 levels.
These zones, at $1.3520 and $1.3329 respectively, are likely to attract buying pressure and set the stage for a rebound.
Fibonacci Demand Pocket and Alternative Support
The chart identifies the Fibonacci demand pocket as the current focal point for XRP. The asset’s price has pulled back into this zone after a strong upward move that followed a prolonged decline within a descending broadening wedge.
The 0.5 level at $1.3520 and the 0.618 at $1.3329 define the main range where XRP could establish support. A reaction in this area would indicate that market participants are defending these levels, potentially forming a higher low. ChartNerd suggests that if this support holds, XRP could resume its upward trajectory.
Should the 0.618 level fail to hold, the 0.786 retracement at $1.3056 represents a secondary support area. This level may offer a final opportunity for buyers to enter before XRP resumes an upward trend. ChartNerd points out that price testing these levels does not confirm direction but highlights zones where significant buying interest may appear.
Technical Observations and Potential Price Movement
The chart also shows a projected path for XRP following a successful reaction at the demand pocket. A higher low at this zone could trigger another leg upward, with the previous resistance near $1.47 acting as a potential target.
ChartNerd emphasizes that price structure is critical in this phase, with the Fibonacci levels serving as reference points for possible entries and exits.
XRP’s recent breakout signals that the previous downtrend is losing momentum. The rebound from the lower boundary of the descending wedge was sharp, confirming that buyers remain active at lower levels. ChartNerd’s analysis suggests that sustaining above the 0.618 Fibonacci level is key for maintaining upward momentum.
XRP’s current retracement toward $1.33 and the 0.618 Fibonacci level is critical for establishing support. If this zone holds, a higher low could form, positioning XRP for another upward push.
Should this level fail, the 0.786 at $1.3056 serves as a secondary support. ChartNerd’s post highlights these key zones, providing traders with clear reference points indicating it is approaching a decisive area that could dictate its near-term trajectory.
The post Analyst to XRP Traders: This Is Where the Reaction Should Be Taking Place appeared first on Times Tabloid.
Ayrıca Şunları da Beğenebilirsiniz
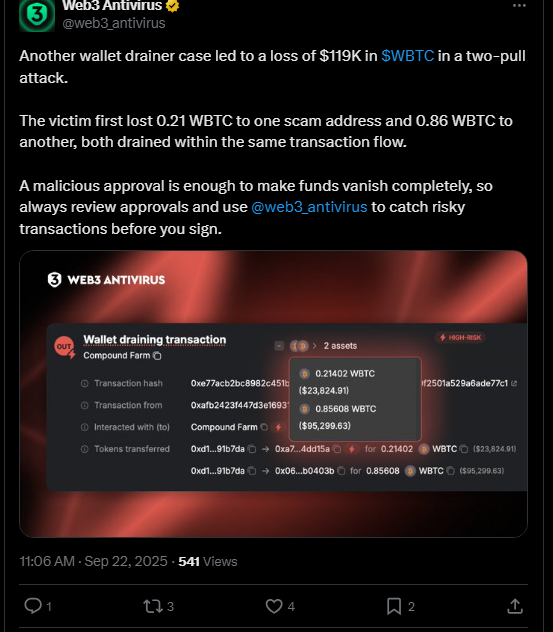
$119K WBTC Drained in Wallet Scam Amid Fake Airdrop Surge

SwayHorizonAi Reviews — Are Their Market Insights Legit? A Quick Overview
