Ethereum (ETH) Price Analysis: Critical Levels After 8% Decline
Quick Summary
- Jeffrey Wilcke, Ethereum co-founder, sent 79,176 ETH (approximately $157M) to Kraken, triggering market concern
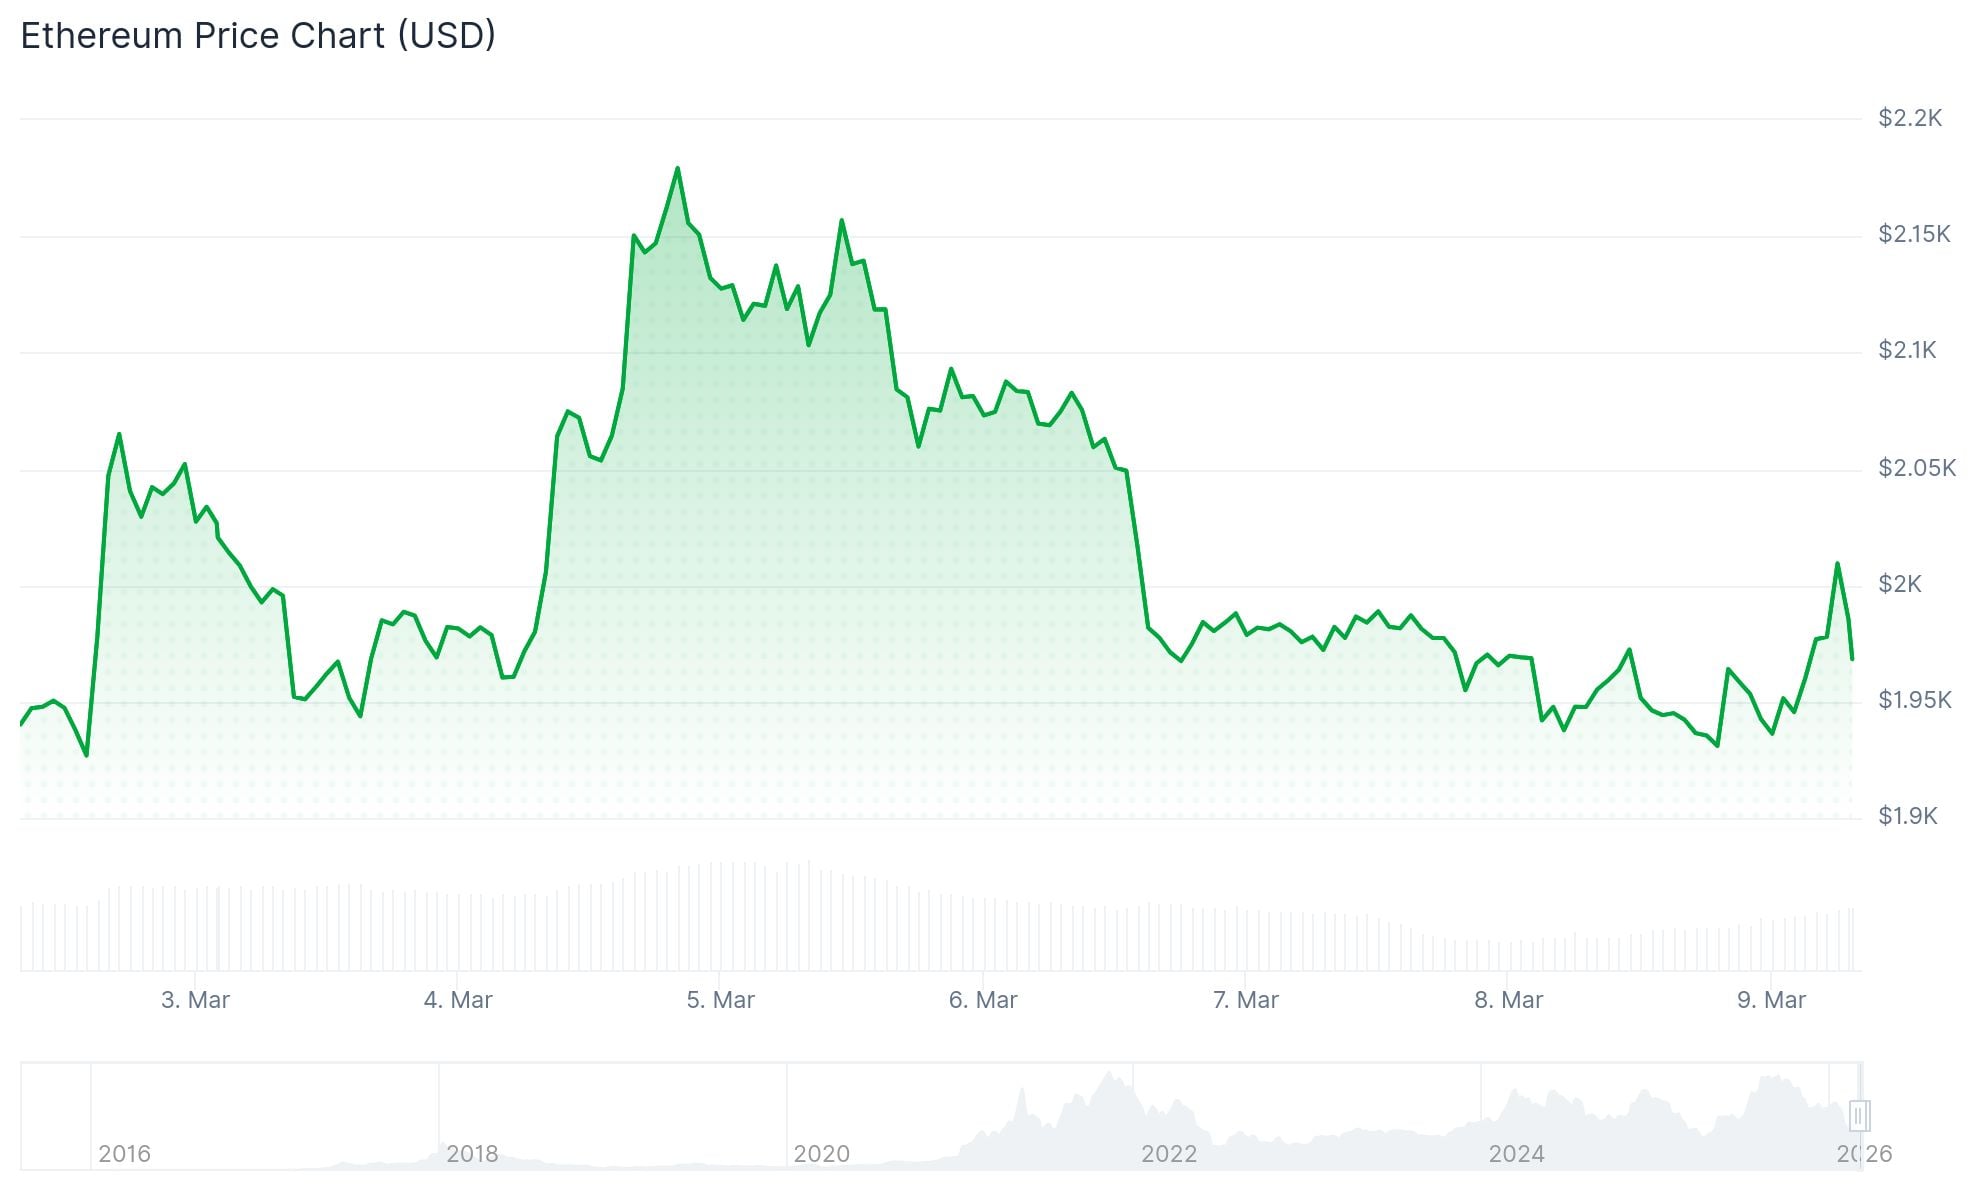
- ETH has declined nearly 8% from March 6, reaching a bottom at $1,912
- Current trading remains under $2,000 and below the 100-hourly Simple Moving Average
- Large whale wallets (100K–10M ETH) continue accumulating during the pullback
- Critical support zone established at $1,900–$1,920; failure could push prices toward $1,800
The Ethereum market has experienced significant downward momentum since March 6, with prices retreating nearly 8% and testing crucial support around the $1,900 mark. The catalyst for this decline was a substantial movement of 79,176 ETH—valued at approximately $157 million—by Ethereum co-founder Jeffrey Wilcke to Kraken exchange.
 Ethereum (ETH) Price
Within cryptocurrency circles, substantial transfers to centralized exchanges typically signal potential selling activity. This transaction created uncertainty among market participants and contributed to the bearish price action already developing.
The digital asset touched a floor of $1,912 before finding some stability. Currently, as of March 9, ETH is changing hands below $1,980 and underneath its 100-hourly Simple Moving Average, maintaining bearish short-term momentum.
Large Holders Provide a Counterbalance
Between March 2 and March 6, Bitcoin spot exchange-traded funds saw net capital inflows totaling $568 million. Ethereum spot ETFs attracted $23.56 million during this same timeframe, demonstrating ongoing institutional appetite despite ETH’s recent price struggles.
Interestingly, not every major holder is rushing to exit positions following Wilcke’s exchange deposit. Data examining different wallet cohorts reveals that addresses controlling between 100,000 and 10 million ETH have been actively accumulating throughout this price decline.
This purchasing activity from substantial investors has provided a cushion against more dramatic price drops. The market now reflects a dynamic tension between selling pressure from the co-founder’s exchange movement and buying interest from other significant stakeholders.
The $1,920 price point has served as immediate support thus far. Should buyers successfully defend this threshold, ETH could stage a rebound targeting $1,980, with $2,000 as the psychological barrier beyond that.
Above current levels, resistance zones are substantial and densely packed. The initial significant obstacle appears at $2,020, with $2,050 representing the next challenge—this level corresponds to the 50% Fibonacci retracement measured from the recent high of $2,200 down to the low of $1,912.
Charts Signal Ongoing Weakness
The technical landscape continues to favor sellers. Virtually all major moving averages are positioned above current price levels. The 200-period EMA stands at $2,899 while the 200-period SMA is located at $3,324, both significantly overhead.
Shorter-term momentum indicators present a more balanced picture. The Relative Strength Index registers at 42.4, the Stochastic oscillator measures 40.4, and the Commodity Channel Index shows −47.7. The Average Directional Index comes in at 29.9, indicating trend presence without reaching extreme levels.
Should the $1,920 floor give way, attention shifts to support near $1,880. A breakdown below that point would bring the $1,800 area into focus—a region where purchasing interest has emerged historically.
As of March 9, 2026, ETH was hovering around $1,939, continuing to struggle beneath the $2,000 threshold that has proven difficult to sustain.
The post Ethereum (ETH) Price Analysis: Critical Levels After 8% Decline appeared first on Blockonomi.
Ayrıca Şunları da Beğenebilirsiniz

Patos (PATOS) Price Alert: 108% Gains Guaranteed from Solana Token?

Safe-Haven Status Faces Unprecedented Pressure As DBS Flags Critical Shifts