Dogecoin Is Forming a Reversal Structure After Weeks of Decline
DOGE price sits at $0.0947 on March 12 after one of the more volatile weeks in its recent history, with a sharp March 11 spike to $0.099 producing the highest volume of the period before a rapid return to the $0.092 to $0.094 range, leaving a long upper wick that tells the same story as every other DOGE rally attempt this year.
The Week’s Price Action
The latest Tradingview chart opens March 5 near $0.0965 and immediately begins declining, grinding lower through March 6 and 7 to reach $0.0880, the week’s low. The descent was orderly rather than panicked, with modest sell volume and no single capitulation candle. A slow recovery followed through March 8 and 9, pushing price back toward $0.0925 before the March 11 event changed the week’s character entirely.
The March 11 move was the most significant single candle on the chart. DOGE launched from $0.0905 to $0.099 on the highest buy volume of the period, briefly touching the psychological $0.10 threshold before sellers appeared immediately. The rejection was fast and complete. Within hours price was back at $0.092, erasing the entire spike and leaving a wick that represents pure failed breakout rather than genuine momentum. The X Money speculation covered in this publication on March 10 was the cited catalyst. The speed of the reversal suggests the market treated the move as a rumor trade rather than a confirmed catalyst.
Since the rejection DOGE has been recovering steadily from $0.0920 toward the current $0.09472, building a sequence of higher lows across March 11 and 12 that keeps the short-term structure from breaking down entirely.
What the Larger Structure Shows
Crypto trader GainMuse’s daily chart provides the context the 2H view cannot. DOGE has been trading inside a descending channel since its highs above $0.47 in late 2024, with a falling resistance line capping every rally attempt and a rising support line that has held through multiple tests. Price is currently compressing toward the lower boundary of a triangle formation that sits within the broader channel structure.
The triangle is the key pattern. Higher lows from the February bottom combined with a flat-to-declining resistance line are creating a tightening apex that is running out of room. The ascending support line running beneath current price is the structural level that defines whether the triangle resolves upward or fails. GainMuse identifies the horizontal resistance above as the target if buyers defend the rising support and momentum builds. The target line on the daily chart sits near $0.11 to $0.12, roughly 16% to 27% above current price.
The CryptoQuant data adds context the chart patterns alone cannot provide. DOGE spent most of 2023 and 2024 in neutral gray territory on the spot volume bubble map, with overheating signals only appearing during the late 2024 rally to $0.47. The current period shows neutral readings with no heating signal yet visible, which means the triangle compression is occurring in a low-attention environment rather than during a speculative surge.
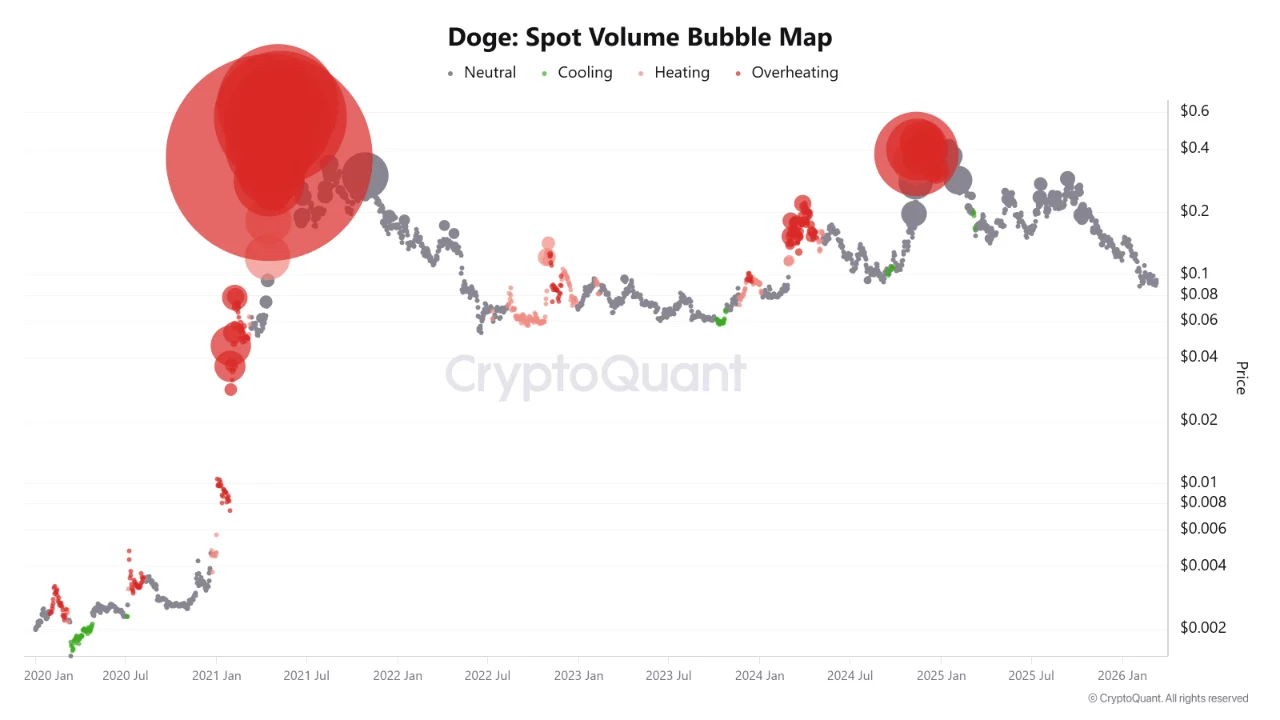 Source: https://cryptoquant.com
The Two Outcomes
Buyers defending the ascending support line and producing a close above $0.096 to $0.097 resistance would confirm the triangle is resolving upward, pointing toward the $0.10 to $0.12 target range. That move requires a catalyst with more substance than the X Money speculation that drove March 11, ideally a confirmed integration announcement or a broader market risk-on move following today’s CPI data.
The support trendline breaking would invalidate the triangle structure and send DOGE back toward the $0.085 to $0.088 range where the week’s lows formed. Below that the descending channel support becomes the next reference point considerably lower.
The structure is forming. The volume is not there yet.
The post Dogecoin Is Forming a Reversal Structure After Weeks of Decline appeared first on ETHNews.
Ayrıca Şunları da Beğenebilirsiniz

The one word Trump refuses to say — and why it matters
US Courts Dismiss Anti-Terrorism Claims Against Binance