Crypto Price Prediction For Today, March 21: XRP, Worldcoin (WLD), SUI
Price action across XRP, Worldcoin, and SUI has settled into tight ranges, with none of the three assets showing a strong directional move yet. That quiet behavior tells an important story. Markets are pausing after recent volatility, and short-term indicators now point to balance instead of momentum.
A closer look at XRP price, WLD price, and SUI price shows similar patterns. Each asset is sitting near key moving averages, with RSI and MACD offering only slight directional clues. That combination often leads to range-bound trading unless a clear level breaks.
XRP Price Action Shows Tight Range Around $1.45 With Balanced Momentum
Recent XRP price activity places it around $1.447, with a 24-hour range stretching from $1.42 to $1.46. Trading volume remains strong around $1.6B, which shows steady participation even though the price is not trending strongly.
| Metric | XRP Price Snapshot (March 21) |
|---|---|
| Current Price | ~$1.447 |
| 24H Range | $1.42 – $1.46 |
| Trading Volume | ~$1.6B |
| RSI (14, 1H) | ~51 (slightly bullish bias) |
| MACD Line | Just below signal line |
| MACD Histogram | Slightly positive (mild momentum improvement) |
A look at the 1-hour chart reveals both the 7-bar and 30-bar moving averages sitting around $1.44. Price is resting directly on those levels. That setup shows equilibrium between buyers and sellers, with neither side in control.
RSI sits around 51, slightly above the neutral 50 level. That position leans mildly bullish but does not support an aggressive move.
MACD adds a similar message. The line remains just below the signal line, yet the histogram has turned slightly positive. Momentum has improved a bit, though not enough to confirm a breakout.
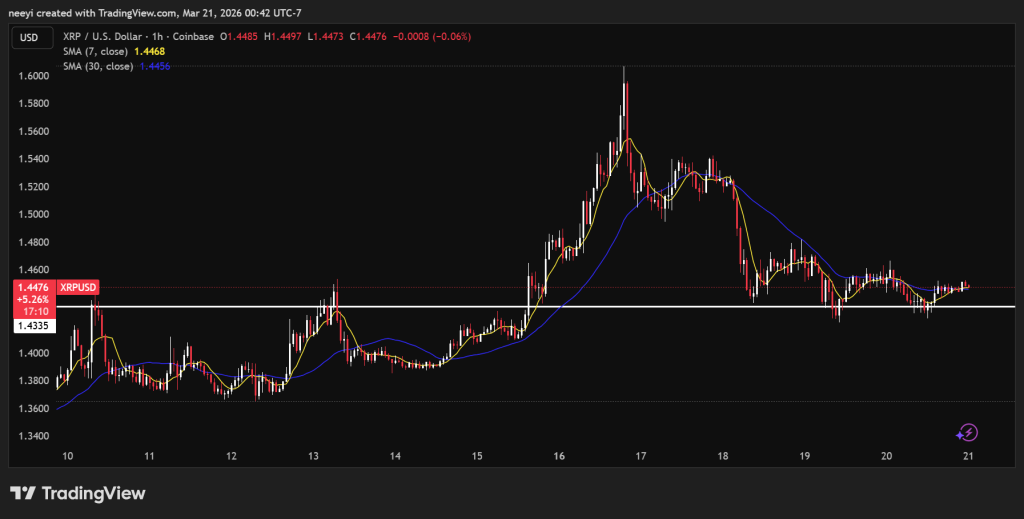 XRP Hourly Price Chart Showing 7H and 30H SMA / Source: TradingView.com
XRP Price Prediction For Today Points To Range Unless Key Levels Break
Short-term signals suggest XRP price may continue moving sideways unless a clear shift appears. The most likely outcome for today keeps price rotating close to $1.45.
The base scenario assumes XRP stays near its moving averages. RSI may remain between 45 and 60, and MACD may stay flat or slightly positive. That combination supports a trading band between $1.43 and $1.47.
A stronger move higher would require XRP holding above the 30-bar moving average and closing consistently above $1.45. RSI would need to climb toward 60 or higher, and MACD would need stronger positive bars. That setup could open the path toward $1.49.
A weaker scenario becomes clearer if XRP drops below both moving averages. That would place price under the $1.43 zone. RSI slipping under 45 and a negative MACD histogram would confirm weakness. Under those conditions, XRP could revisit $1.41 support.
Worldcoin (WLD) Price Holds Below Moving Averages With Mild Downward Pressure
Worldcoin has not shown the same balance as XRP. WLD price trades around $0.319 after falling around 2% over the past 24 hours. The price range stayed between $0.31 and $0.34, with trading volume around $200M.
| Metric | WLD Price Snapshot (March 21) |
|---|---|
| Current Price | ~$0.319 |
| 24H Change | ~-2% |
| 24H Range | $0.31 – $0.34 |
| Trading Volume | ~$200M |
| RSI (14, 1H) | ~38 (selling pressure, not oversold) |
| MACD Histogram | Slightly negative (weak downward momentum) |
Price currently sits below both the 7-bar and 30-bar moving averages on the 1-hour chart. That placement leans bearish in the short term. RSI stands around 38, which shows selling pressure without entering extreme territory. MACD histogram remains slightly negative, pointing to weak downward momentum.
This combination shows a soft downtrend rather than a sharp selloff. Price is easing lower after earlier strength, and buyers have not yet reclaimed control.
WLD Price Prediction for Today Shows Sideways Drift With Risk Of Lower Support Test
The base case assumes price continues to hover just below the moving averages. RSI may stay between 35 and 45, and MACD may remain slightly negative. That supports a range between $0.31 and $0.34 for today.
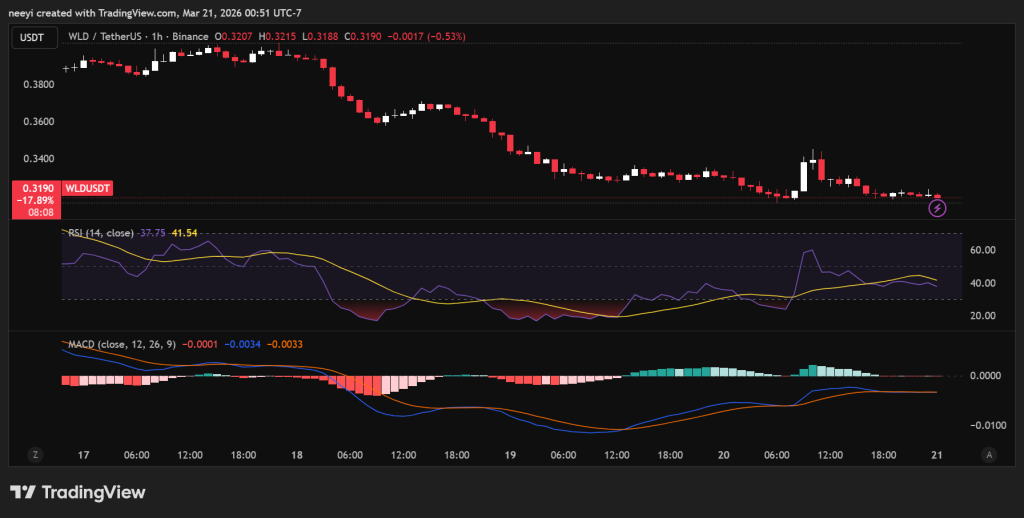 WLD Price Chart Showing RSI and MACD Readings / Source: TradingView.com
A recovery would require WLD pushing back above $0.34 and holding that level on short timeframes. RSI would need to return toward 50, and MACD would need to turn clearly positive. That move could bring price back toward $0.35.
Downside risk increases if price falls below $0.31 with stronger momentum. RSI moving closer to 35 and a deeper negative MACD histogram would confirm pressure. That path could lead toward the low $0.30 region.
SUI Price Stabilizes Near $0.97 After Cooling From Weekly Highs
SUI price shows a different structure compared to WLD. Over the past week, SUI traded above $1.05 before easing into the mid $0.90 range. Recent action shows stabilization instead of continued decline.
The current price sits around $0.96, with a 24-hour range between $0.95 and $0.98. Daily change remains slightly positive by around 1%, supported by trading volume near $300M.
| Metric | SUI Price Snapshot (March 21) |
|---|---|
| Weekly Context | Traded above $1.05, then cooled into mid $0.90 range |
| Current Price | ~$0.96 |
| 24H Range | $0.95 – $0.98 |
| 24H Change | Slightly positive (~1%) |
| Trading Volume | ~$300M |
| RSI (14, 1H) | ~46 (slightly bearish bias) |
| MACD Histogram | Slightly positive (mild upward pressure) |
Both the 7-bar and 30-bar moving averages align closely around $0.97. Price is sitting directly on those levels, which mirrors the balanced setup seen in XRP. RSI stands near 46, which is slightly bearish. MACD histogram shows small positive values, pointing to mild upward pressure.
SUI Price Prediction Suggests Consolidation With Slight Upside Bias
Indicators show SUI moving through a consolidation phase with a small bullish lean.
The base scenario keeps SUI within a $0.95 to $0.99 range. RSI may stay between 45 and 60, and MACD may remain slightly positive. That structure supports slow and steady movement without strong direction.
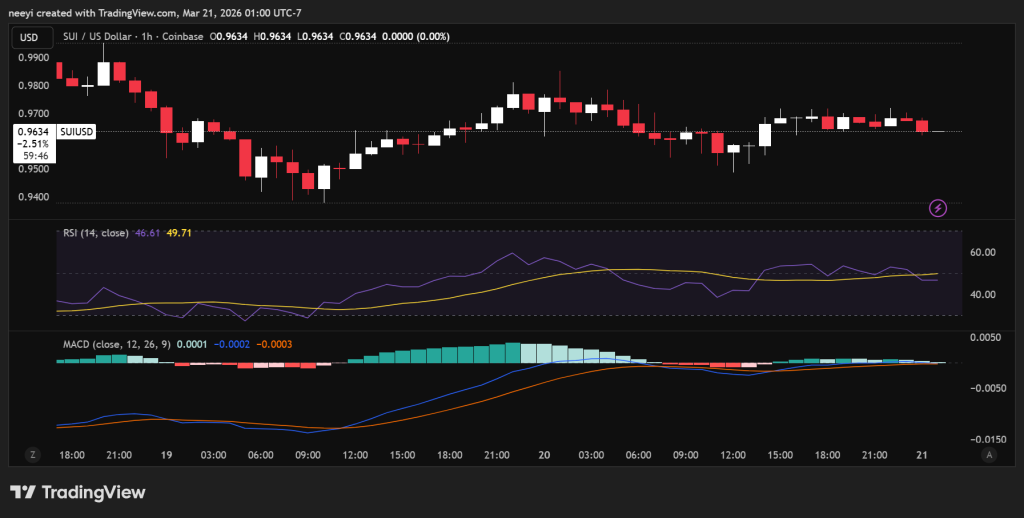 SUI Price Chart Showing RSI and MACD Readings / Source: TradingView.com
Upside continuation would require SUI holding above $0.97 and pushing toward $0.98 with consistent closes on the smaller timeframes. RSI rising toward 60 and stronger MACD bars would confirm strength. That could bring price closer to $1.00.
A downside move becomes more likely if SUI falls below $0.95 and pulls both moving averages lower. RSI dropping under 45 and a negative MACD histogram would support that case. Price could then move deeper into the low $0.90 region.
Markets now sit at a point where balance dominates across XRP, WLD price, and SUI price. None of the three assets show a decisive move yet. The next clear direction will likely come from a break above resistance or below support, and that moment could define how the rest of the week unfolds.
Subscribe to our YouTube channel for daily crypto updates, market insights, and expert analysis.
The post Crypto Price Prediction For Today, March 21: XRP, Worldcoin (WLD), SUI appeared first on CaptainAltcoin.
Ayrıca Şunları da Beğenebilirsiniz

XRP Ledger Transactions Are Exploding. Here’s the Latest

Trump's 'massive political weakness' has him trapped with no way out: analyst