

Ethereum (ETH) Price: Whale Wallets Exit as Macro Pressure Builds
TLDR
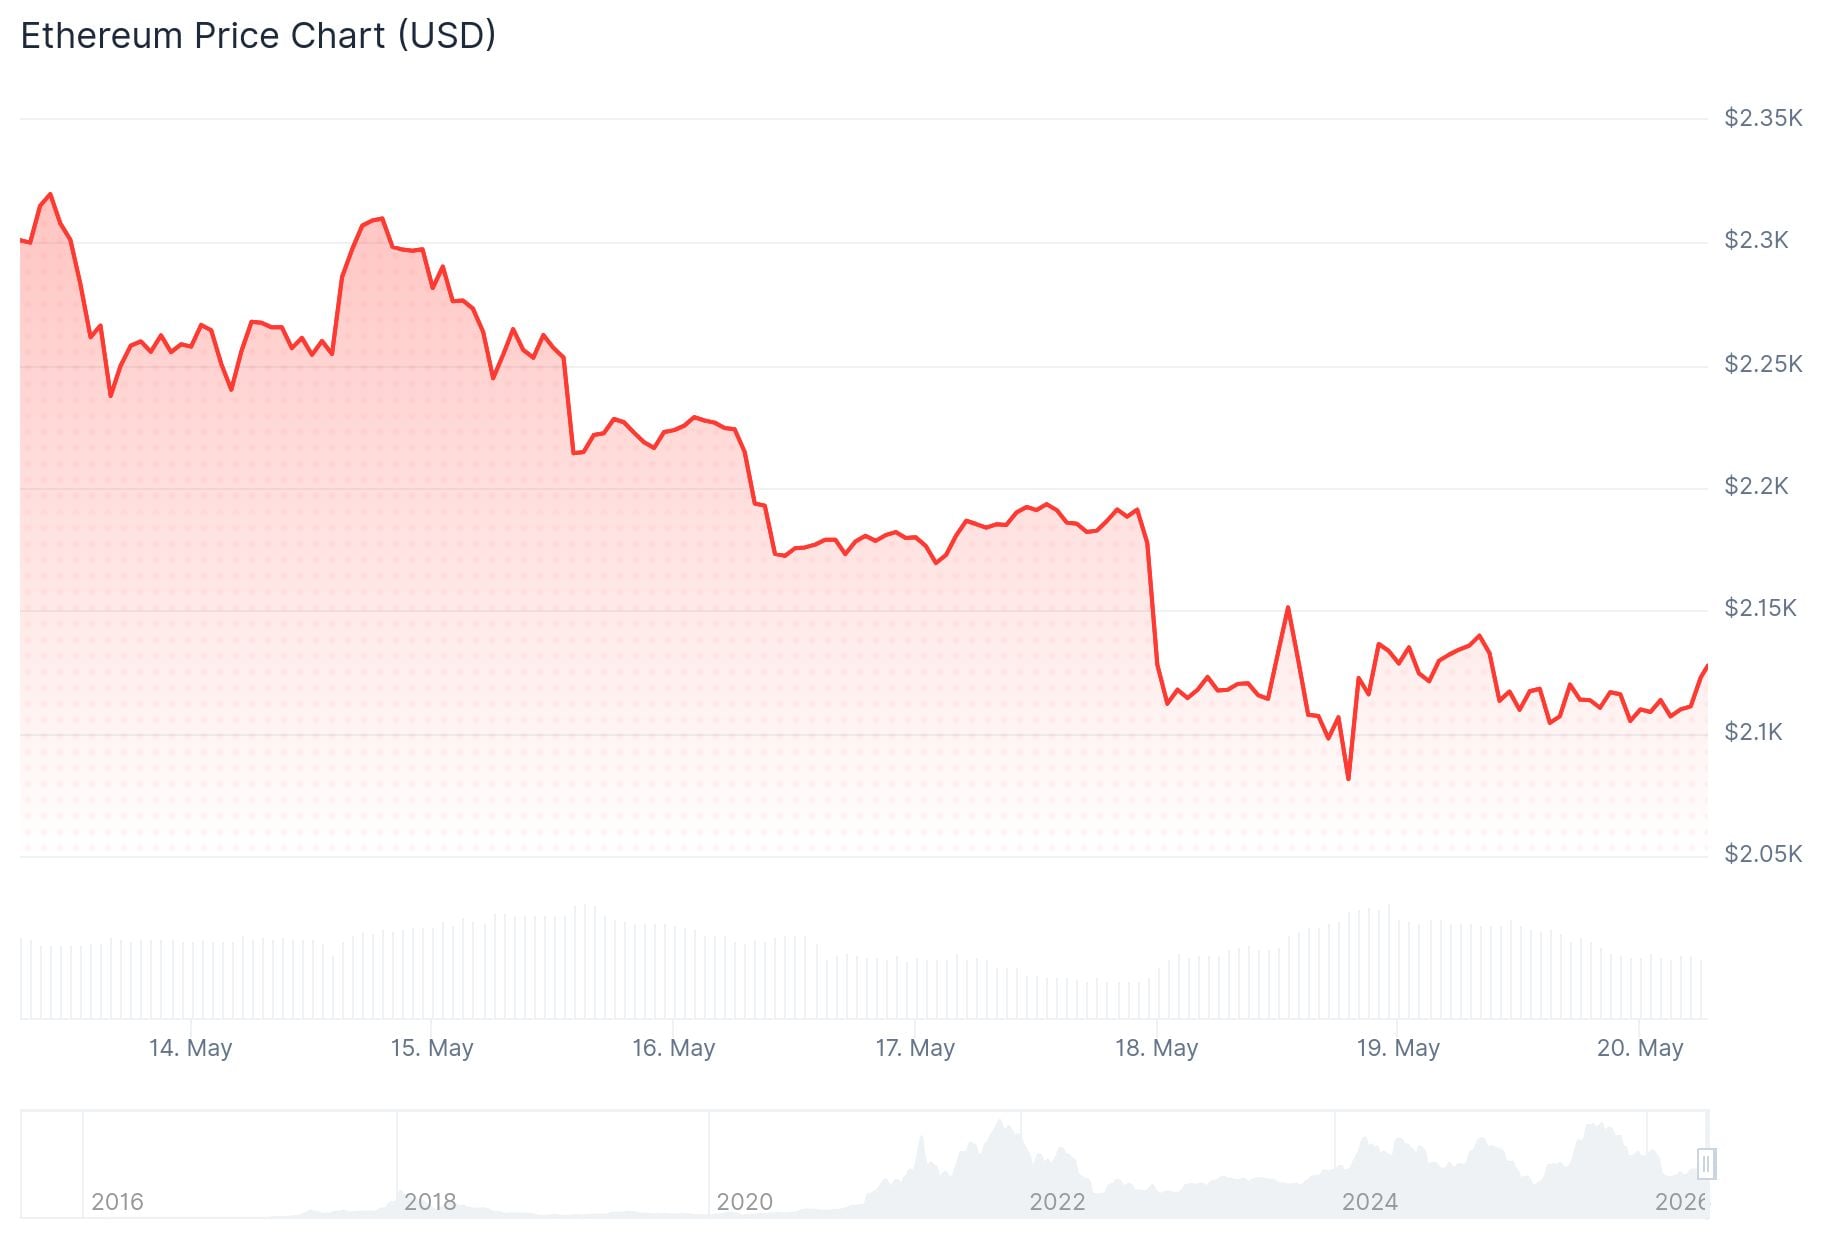
- ETH dropped over 10% in the past week, falling to around $2,110, hit harder than most major cryptos.
- Rising US Treasury yields and inflation data triggered broad crypto sell-offs, with the US 30-year yield hitting 5.19%, its highest since 2007.
- More than $700 million in long positions were liquidated on ETH over the past week.
- Mid-tier wallets sold a combined 386,000 ETH between May 11–18, while whale accumulation also began to taper off.
- Analyst Crypto Patel identified $1,500 as a downside target after ETH broke below a key trendline at $2,170.
Ethereum is trading around $2,110, recovering slightly after a week of heavy selling pressure. The price is up roughly 0.5% on Tuesday, but the broader picture remains weak.
 Ethereum (ETH) Price
The sell-off was not isolated to ETH. A sharp rise in US Treasury yields pulled capital away from risk assets across the board. The US 30-year yield climbed to 5.19%, its highest level since 2007. Japan’s 10-year government bond yield also hit a record high of 2.81%. When yields rise, investors often shift toward safer, income-generating assets, which tends to weigh on cryptocurrencies.
Still, ETH took a larger hit than most. According to Coinglass data, ETH recorded more than $700 million in long liquidations over the past week, outpacing Bitcoin’s upside liquidations during the same period. Derivatives data had already shown signs of a long squeeze forming before the drop.
Wallet Data Points to Continued Distribution
Onchain data from CryptoQuant shows that wallets holding between 100 and 10,000 ETH sold a combined 386,000 ETH from May 11 to May 18. This distribution pattern has persisted over recent months.
Whales initially stepped in to buy the dip, accumulating around 330,000 ETH during that same stretch. However, they later reduced their holdings by 60,000 ETH over the following days, suggesting some cooling of conviction at current price levels.
Analyst Ali Charts flagged a concerning trend on social media: approximately 60 whale addresses holding 10,000 ETH or more have either emptied or consolidated their balances over the past two months. He noted this aligns with heavy exchange inflows and called the path of least resistance “down,” while watching the $2,000 level closely.
Technical Picture Remains Bearish
On the daily chart, Ethereum is trading below its 20-, 50-, and 100-day exponential moving averages, which are grouped between $2,245 and $2,333. The RSI is near 34 and the Stochastic Oscillator sits around 12, both reflecting continued downside pressure with no clear reversal signal.
Analyst Crypto Patel noted on social media that ETH broke below a key rising trendline at $2,170, shifting the structure bearish. He set a downside target of $1,500 and an invalidation level at $2,327.
On the hourly chart, ETH is forming a bearish trend line with resistance near $2,120. A failure to clear $2,150 could lead to a retest of $2,075, with $2,000 as the next major support below that.
Key resistance above sits at $2,120, then $2,150, and $2,200. The nearest support levels are $2,085 and $2,075. A break below those could expose the $2,000 psychological level.
As of May 20, ETH is trading just above $2,108, with technical indicators and onchain data both pointing toward caution in the near term.
The post Ethereum (ETH) Price: Whale Wallets Exit as Macro Pressure Builds appeared first on CoinCentral.


Ayrıca Şunları da Beğenebilirsiniz

PMI-ACP Exam Preparation: How to Use a Simulator and Practice Questions Effectively

Bitcoin (BTC) Hovers Above $77K Amid Iran Diplomacy and Rising Treasury Yields


