

Gold’s Worst Quarter in Over a Decade: What’s Driving the Crash
TLDR
- Gold is on track for its worst quarterly decline since 2013, down roughly 24% from its January peak.
- Gold Futures traded near $4,031.70, after briefly dipping below $4,000 for the first time since November 2025.
- A strong U.S. Dollar Index near a 13-month high and rising Fed rate-hike bets are driving the selloff.
- Options data shows traders paying more for downside protection than upside exposure for the first time since 2016.
- Goldman Sachs still expects gold to rebound to $4,900 by the end of 2026, citing central bank demand.
Gold prices have dropped sharply over the past few months. The metal is now headed for its worst quarterly performance since 2013.
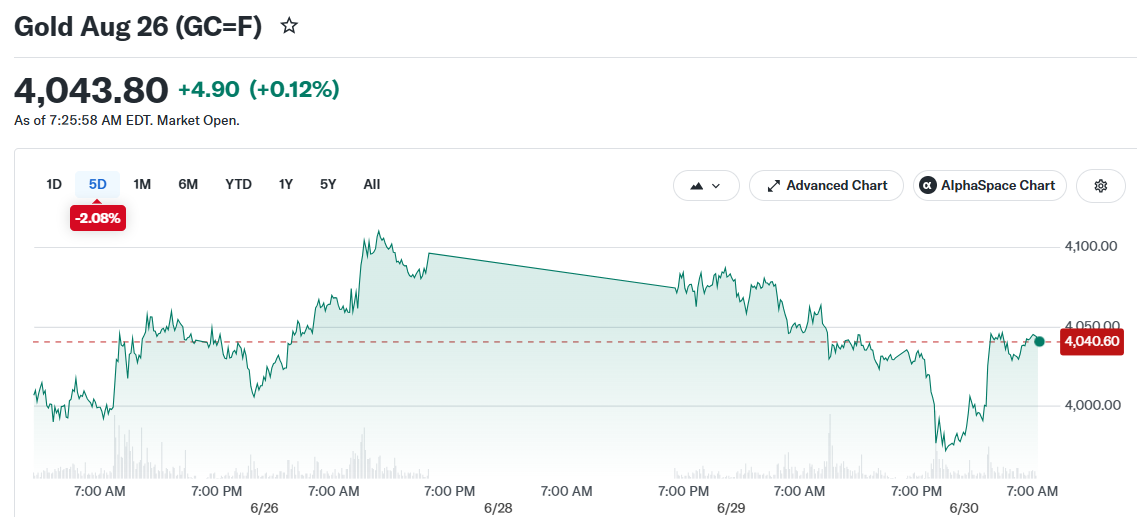
Gold has fallen about 24% from its late-January high near $5,589 an ounce. On Tuesday, Gold Futures for August delivery traded at $4,031.70.
 Gold Aug 26 (GC=F)
Earlier in the week, gold touched a fresh seven-month low of $3,941. The metal briefly recovered some ground, trading around $4,028 by the time markets opened.
Why Gold Is Falling
The main reason for the drop is a stronger U.S. Dollar. The Dollar Index is trading near a 13-month high.
A stronger dollar makes gold more expensive for buyers using other currencies. This reduces demand and pushes prices lower.
Investors are also pricing in a higher chance of a Federal Reserve interest rate hike. The CME FedWatch Tool shows a 63% probability of a rate increase at the September meeting.
Gold does not pay interest. When interest rates rise, investors often prefer assets that generate yield instead of holding gold.
Inflation pressure tied to the Middle East conflict has added to the uncertainty. Rising energy costs have pushed inflation expectations higher, which has made the Fed’s policy outlook more hawkish.
This week’s U.S. labor data will be closely watched. The JOLTS report, ADP Employment Change report, and Nonfarm Payrolls report are all due before the July 4th holiday weekend.
A stronger-than-expected jobs report could push the dollar even higher. That would likely add more pressure on gold prices heading into the third quarter.
What Options Markets Are Showing
There has been a shift in how traders are positioning for gold’s next move. For the first time since 2016, the cost of gold put options has moved above the cost of call options.
This means more traders are paying for protection against further price declines than they are betting on a rebound.
Goldman Sachs commodity co-head Samantha Dart pointed to this shift as a sign of changing sentiment. She said that demand has moved away from energy-related upside bets toward gold puts.
Despite this, Dart said she does not see gold’s longer-term trend turning negative. In a note published June 29, she said structural and economic factors should support higher prices later in the year.
Goldman’s official forecast is for gold to reach $4,900 by the end of 2026. That would represent a rebound of about 21% from current levels.
A survey of 90 central banks and public investment funds, released June 30 by OMFIF, found a shift away from dollar holdings. For the first time, more institutions said they plan to reduce dollar reserves than increase them over the next decade.
A net 30% of those surveyed said they plan to increase gold holdings over the next one to two years.
Gold has also lost some of its usefulness as a hedge against stock market declines. Earlier in the year, gold moved in the opposite direction of stocks during market stress. That relationship has since flipped, with gold now moving more in line with stock prices.
On the price chart, gold is trading below its 50-day, 100-day, and 200-day moving averages, which are clustered between $4,440 and $4,660. Analysts say a break below $4,000 could open the door to further losses, with the next support levels seen near $3,885 and $3,750.
The post Gold’s Worst Quarter in Over a Decade: What’s Driving the Crash appeared first on CoinCentral.


Ayrıca Şunları da Beğenebilirsiniz

Google’s latest ad reimagines the Declaration of Independence with AI — and the internet has thoughts

Bitcoin ETFs Post Best Day in 2 Months Despite $5.4B Annual Outflows

LIST: Bayanihan initiatives amid soaring oil prices


Popüler Haberler
Daha fazla
